A Complete Guide to Using Pingdom to Improve (and Monitor) the Speed of a Website – Effectively!
- By
- Last updated:
- Leave your thoughts
Trying to use the Pingdom speed test tool to optimize your site’s performance?
The Pingdom speed test tool is pretty easy to get started with — you just plug in your page’s URL and you get instant results. But, if you want to get value from those results, you’ll need to understand how to interpret them in an actionable way.
That’s what we’ll teach you in this post, where you’ll learn the following:
- How to use the free Pingdom speed test tool and what all of the data/results mean for your site.
- Some actionable tips to improve your Pingdom scores (and also why load times are more important than ‘scores’).
- Why Pingdom’s paid plans might be worth the money if you want more advanced performance monitoring and analysis. You can test everything with a 30-day free trial (no credit card needed).
- Some other helpful speed test tools that you can use to supplement Pingdom and access other data, such as your site’s Core Web Vitals metrics.
💡 Note: Considering upgrading to WordPress-optimized high-performance hosting? Take a look at this other post of ours comparing The Best Managed WordPress Hosting Services.
If you want to jump to a specific section, you can use the table of contents below. Otherwise, keep reading through the full post to learn everything there is to know about how to use Pingdom and its many free and paid features.
Table of Contents
- How to Use Pingdom’s Free Speed Tests
- How to Use Pingdom’s Free Advanced Performance Analysis Tools
- Limitations of the Free Pingdom Speed Test Tool
- Premium Pingdom Features — These Are Where Pingdom Stands Out
- The Pingdom Mobile App
- Pingdom Pricing
- Four Quality Pingdom Alternatives for Speed Testing
- Get Started With Pingdom Today
How to Use Pingdom’s Free Speed Tests
When most people think of Pingdom, they probably think of Pingdom’s popular free speed test tool.
To use the free speed test tool, all you need to do is:
- enter the URL of the page you want to test
- choose where to test from (i.e. the test location closest to your target audience)
- click Start Test.
After a few seconds, you should see something like this:
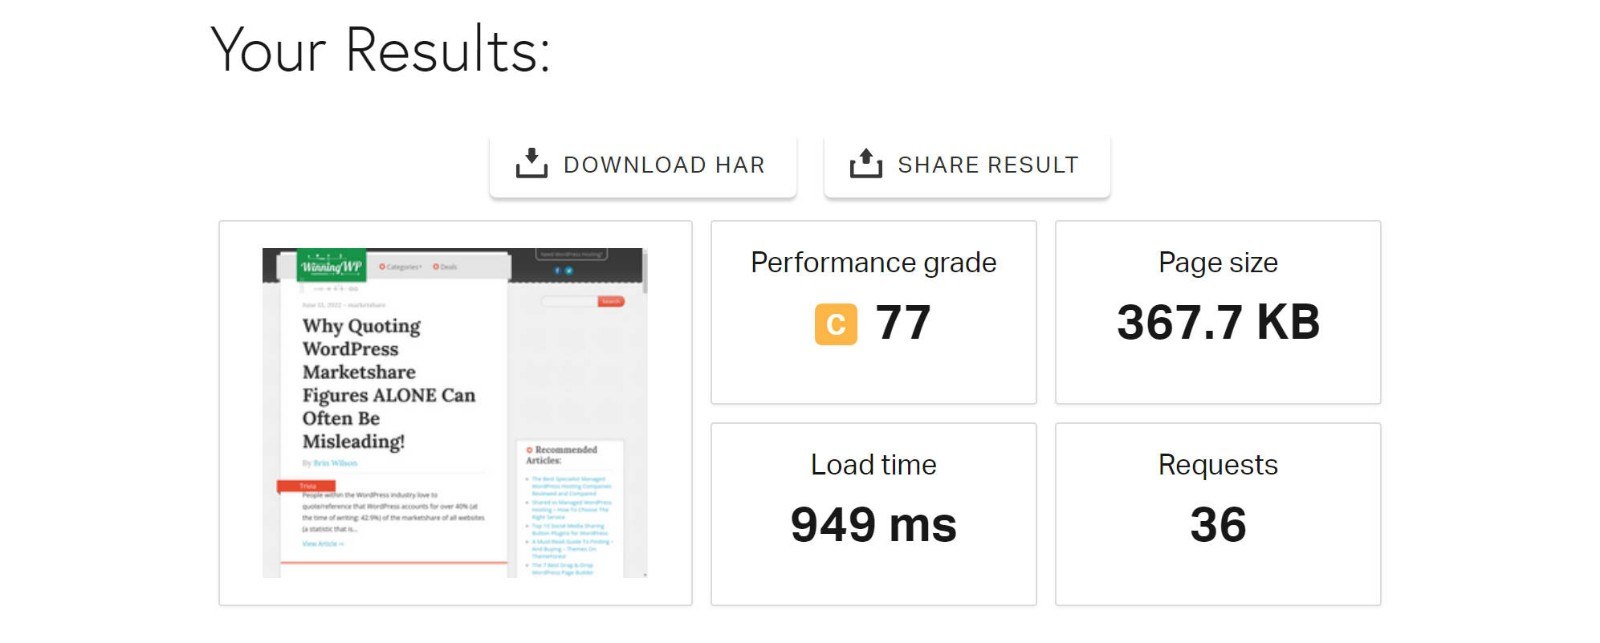
Let’s go through some basic FAQs/tips for how to use and understand Pingdom’s basic speed results. Then, we’ll dig into some of the deeper analysis tools.
How Does Pingdom Calculate Load Time?
While it’s easy to get caught up in optimizing your website’s ‘speed score’, the only thing that really matters is your site’s Load Time. Generally, you want to aim for under two seconds if possible.
However, it’s important to understand ‘Load Time’ isn’t always the same across different tools because there are different metrics.
There are two main ways to consider a website as ‘loaded’:
- Onload time — the processing of the page is complete and all resources (e.g. images) have loaded. However, this doesn’t include some events, such as JavaScript, that are important to your page.
- Fully Loaded Time — the time when the page has completely stopped loading content. This will always be slower than the onload time.
Google has also introduced more user experience-focused load metrics, such as Largest Contentful Paint (which is part of Google’s Core Web Vitals initiative, a new SEO ranking factor). Instead of looking at how long it takes your site to fully load, Largest Contentful Paint only looks at how long it takes for your ‘main’ content to load.
Because Google now uses Largest Contentful Paint as a ranking factor, many users have started focusing on this as a primary performance metric.
Pingdom exclusively uses onload time, whereas other tools, such as GTmetrix and WebPageTest, let you choose between the different metrics, including the new Largest Contentful Paint metric.
There’s nothing wrong with using this metric, but it’s important to understand that, because of how it calculates load time, your site’s ‘load time’ will usually be faster in Pingdom than it is in other tools that use fully loaded time, because you’re often comparing apples to oranges.
Additionally, the fact that Pingdom doesn’t include Largest Contentful Paint means it’s tough to assess your site’s performance in Core Web Vitals. Later, we’ll share some tools you can use to test Largest Contentful Paint, if that’s important to you.
Which Pingdom Test Location Should You Use?
Currently, Pingdom offers seven different test locations for its free speed test tool:
- Asia — Tokyo, Japan
- Europe — Frankfurt, Germany
- Europe — London, UK
- North America — Washington D.C., USA
- North America — San Francisco, USA
- Pacific — Sydney, Australia
- South America — Sao Paulo, Brazil
So, which location should you choose?
If your site targets a specific geographic area, you should choose the test location that’s closest to that area. For example, if you have a local business in Los Angeles, you’ll want to pick the San Francisco test server.
However, if your site targets visitors worldwide, you’ll want to run tests from different locations. This will let you see how your site will load for visitors around the world.
If you notice slow load times in certain areas, you may want to start using a content delivery network (CDN) to speed up your global page load times.
What Is the Pingdom Performance Grade?
In addition to your site’s load time, page size and HTTP requests, Pingdom also gives your site a ‘performance grade’.
You shouldn’t put too much emphasis on the performance grade itself — the most important metric is your site’s load time, as this is what your visitors will actually experience.
However, the performance grade does give you a quick glance at how optimized your site’s front-end performance is. The other aspect of performance is back-end performance, such as choosing quality website hosting.
Your performance grade comes from the weighted average of the Improve Page Performance suggestions (more on those in a second).
Overall, don’t obsess about improving your performance grade — focus on lowering your load time. If your site loads in under two seconds, your visitors won’t care what your site’s performance grade is.
How to Use Pingdom’s Free Advanced Performance Analysis Tools
In addition to basic information on your site’s load time, file size and HTTP requests, Pingdom also includes some advanced analysis tools that dig deeper into your site’s performance.
Whereas the metrics in the box at the top are basically a snapshot of how your site’s doing, the analysis metrics below it help you to dig in and improve your site’s performance.
Basically:
- Summary box — ‘how is my site doing now?’
- Advanced analysis — ‘how can I make my site better?’
Let’s go through the different sections…
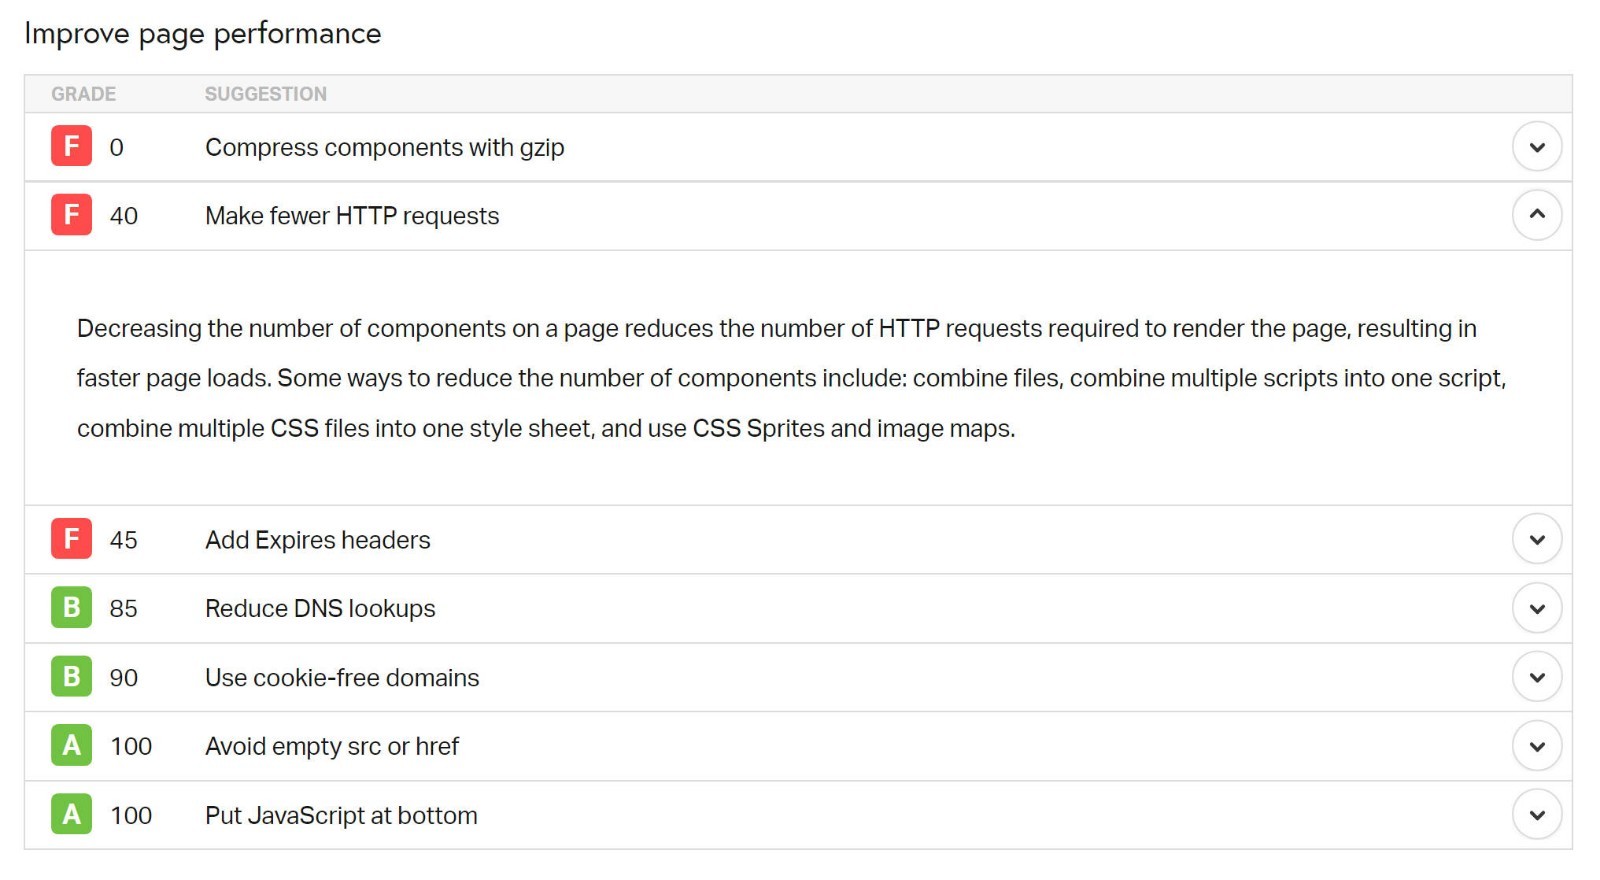
Improve Page Performance
The Improve Page Performance section includes seven popular optimization tactics, as well as a score that indicates how well your site is already implementing each tactic:
- Make fewer HTTP requests
- Add Expires headers
- Compress components with gzip
- Use cookie-free domains
- Reduce DNS lookups
- Avoid empty src or href
- Put JavaScript at bottom
If you’re unsure what something means, you can click the arrow icon on the right to view an explanation.
Note: In some cases, you may not have control over everything you’d need to bring the score up to 100%, but that’s okay — the goal is to tick off as many as possible. Don’t stress if you still have a few hard-to-solve yellow (or even red) warnings at the end of your efforts. Again, these are suggestions to improve your site’s load times, but you can still have a quick-loading site even if you fail a few tests.
If you do want to improve your score, here’s a breakdown on how to improve the various suggestions…
Compress Components with Gzip
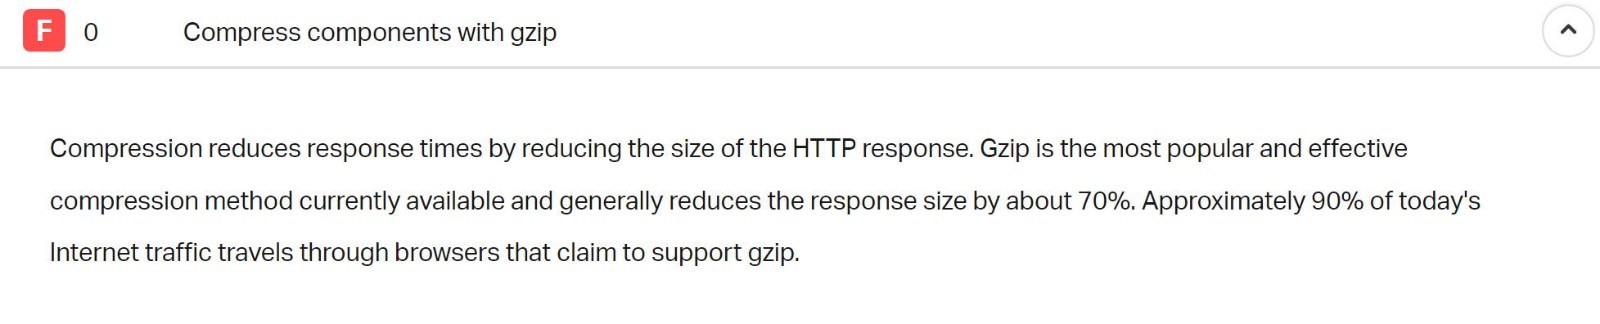
Gzip compression lets you shrink the size of your site’s files by compressing them at the server level. However, Pingdom is out of date on this point because it only looks for Gzip compression and not Brotli compression.
Brotli is a slightly newer compression algorithm that also offers great file savings. However, if you implement Brotli, you’re going to fail this check in Pingdom, which is the case for WinningWP. This doesn’t really make sense — it’s something that Pingdom should fix.
Overall, you’ll want to implement either Gzip or Brotli:
- To learn more about how Gzip works and how you can implement it, check out our WordPress Gzip tutorial.
- If you want to use Brotli, the easiest option is to set up your site on Cloudflare and enable the Brotli compression option in Cloudflare’s settings.
Make Fewer HTTP Requests
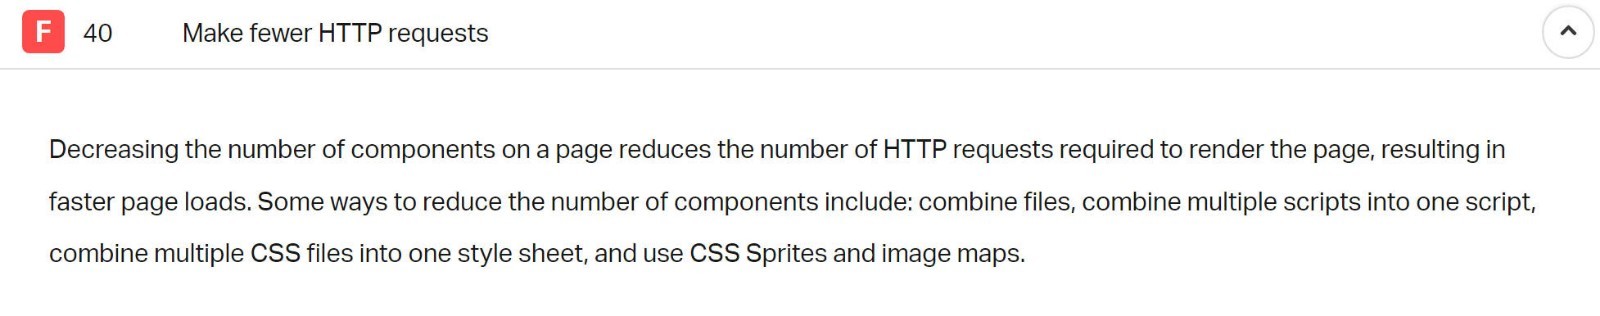
Every resource your site loads requires an HTTP request from the visitor’s browser to your site’s server (or the server of a third party in some cases).
For example, each individual image is a request, each individual script, each individual CSS stylesheet, each individual font file, and so on.
In general, the more requests your site requires, the slower it’s going to load, which is why it’s a good idea to reduce them as much as possible.
With that being said, it’s not quite that simple because some HTTP requests are larger and/or take longer than others. Additionally, the raw number of HTTP requests isn’t quite as important anymore if your site uses HTTP/2 because HTTP/2 supports multiplexing (allowing multiple requests to be transferred at the same time).
Many modern WordPress hosts already use HTTP/2 — you can consult your host’s documentation or support if you’re not sure.
In the past, it was a good performance best practice to ‘combine’ scripts or CSS files into one larger file to reduce HTTP requests that way. But, now that HTTP/2 supports multiplexing, that’s not needed if your host uses HTTP/2.
Instead, you’ll want to focus on finding and eliminating unnecessary requests. Here are some tips to do that:
- Use the Pingdom waterfall analysis to find slow-loading requests. I’ll show you how to use this tool a little later in the post.
- Delete unnecessary plugins, because many plugins will add their own HTTP requests. You can also consider replacing plugins that add a lot of requests with more lightweight options. Again, the waterfall analysis we discuss later can help you to find these plugins.
- Lazy load your images to avoid forcing visitors’ browsers to request all image files on the initial page load. WordPress now supports built-in lazy loading for images, so you don’t need to do anything extra if you’re using WordPress.
- Limit custom font usage. Every font and font weight/style you load is a separate HTTP request, so you’ll want to limit how many you use. To really reduce HTTP requests, you can use a native system font stack, which doesn’t require any HTTP requests.
- Combine HTTP requests (if using HTTP/1). If your host still uses HTTP/1, it is good practice to combine HTTP requests whenever possible. For example, instead of having five separate CSS stylesheets, you could combine them all into one single HTTP request. You can set this up using plugins such as WP Rocket (paid — our review) or Autoptimize (free).
- Avoid loading unnecessary scripts sitewide. For example, if you only use WooCommerce to process payments, you don’t need to load WooCommerce’s scripts across your entire site. You can conditionally load/deload scripts using plugins such as Asset CleanUp or Perfmatters.
Add Expires Headers
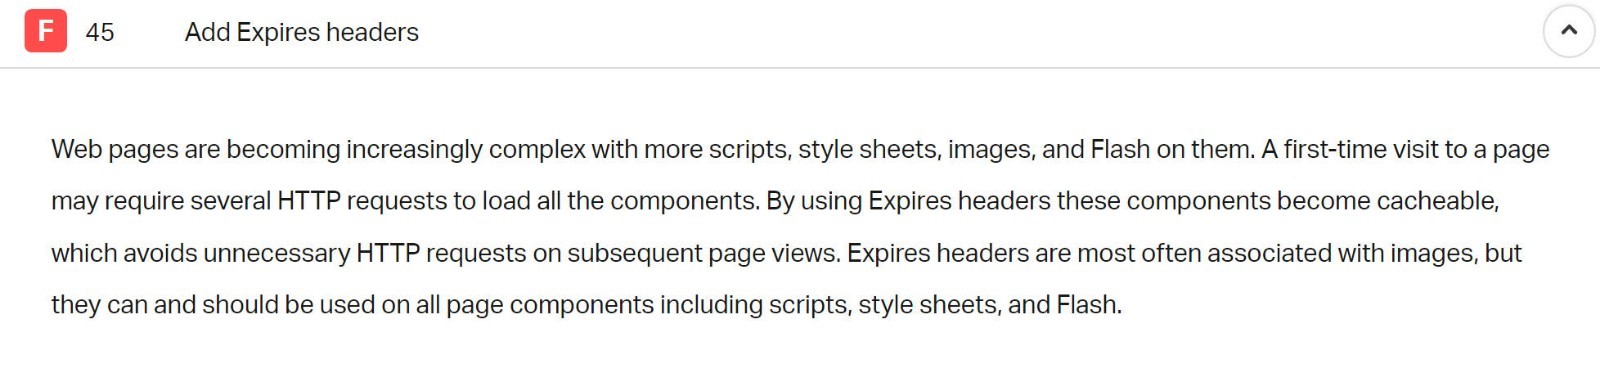
Adding Expires helps you to implement browser caching for your site, which is why this check used to be called ‘leverage browser caching’ (and is still called that in a lot of other tools).
With browser caching, your site can tell users’ browsers to store static files on users’ local computers instead of loading them from your site each time. For example, instead of loading your site’s logo on each pageview, you could save it in the local cache after the first pageview, so visitors’ won’t need to re-download the same logo image for subsequent visits.
You can add Expires headers/leverage browser caching using custom code or various plugins. For a more detailed look, check out our guide on how to enable browser caching in WordPress.
Use Cookie-Free Domains
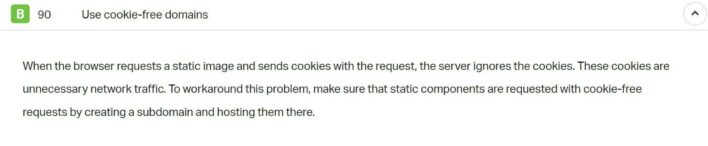
Cookies are small bits of data that your website might send to visitors’ browsers. Typically, these are used for tracking or managing a user’s session (e.g. keeping them logged in).
Cookies serve a purpose. However, your site should not be sending cookies for static files, such as images, as this is just a waste of network traffic.
Honestly, most sites can ignore this warning as it’s not as important if your server is using HTTP/2. However, if you want to fix this and score a perfect score, you have two options:
- Use a content delivery network (CDN). These should automatically remove cookies. Here are our picks for the best CDN services.
- Serve your site’s images and static files from a subdomain — e.g. static.yoursite.com/image.jpg. For most WordPress sites, this adds needless complexity for very little benefit, so I don’t actually recommend doing this. I’m only sharing it as a potential solution.
Avoid Empty src or href
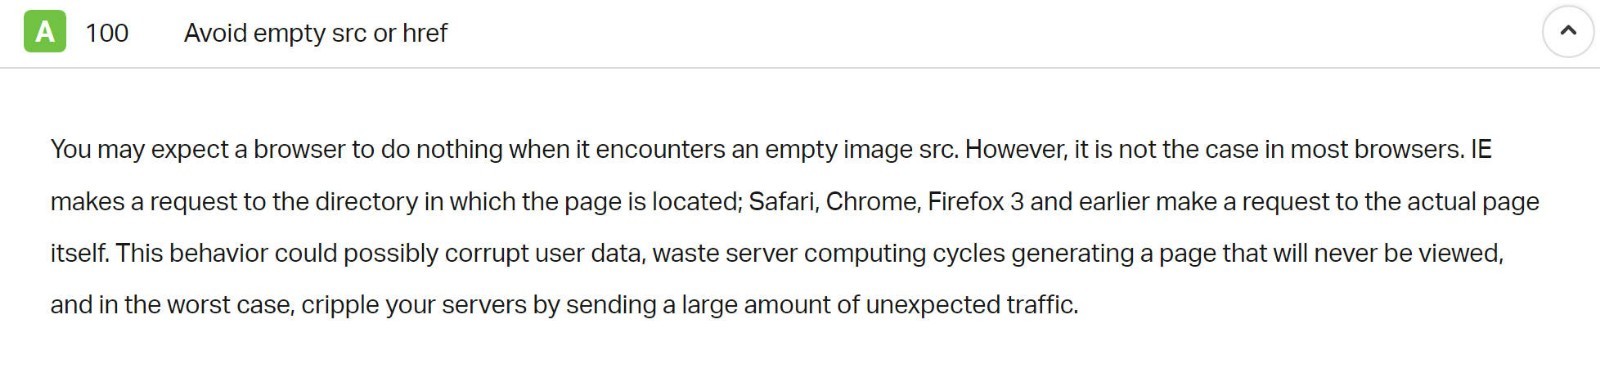
An empty src or href refers to adding an image or link in your site’s code but not actually specifying the source of the image.
While this is unlikely to happen to WordPress sites unless you’re manually adding code, it’s important to avoid it because browsers may interact with these empty code snippets in a way that wastes resources — typically by making an extra request to your site’s homepage.
If your site doesn’t score 100 here, you’ll want to open your source code and search for these two snippets:
src=""href=""
If you find instances of empty src or href, you can either remove them or add the link/file that’s supposed to be there.
Put JavaScript at the Bottom
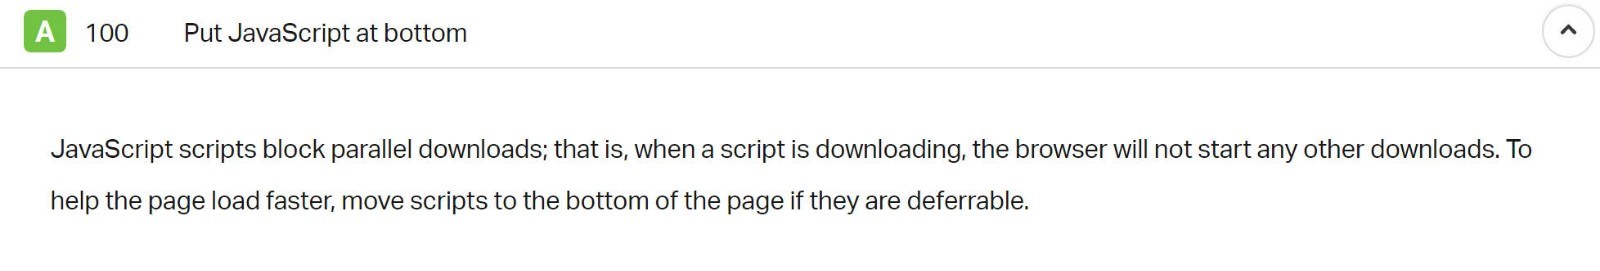
If your site loads JavaScript at the top of the page, your visitors’ browsers will need to wait to download that JavaScript before they can load your page content, which will slow down your site’s perceived load time and hurt metrics such as Largest Contentful Paint.
To avoid this, you want your site to load JavaScript after it’s already loaded the main visible content for your visitors.
There are two ways to achieve this:
- Defer JavaScript loading — your site will wait to load JavaScript until after the main content has loaded, which speeds up your site’s initial load times.
- Delay JavaScript execution until user interaction — this is a more aggressive strategy that completely waits to load JavaScript until a user interacts with the page (e.g. clicking or scrolling). Some sites have started moving to this approach because it offers pretty impressive initial load times. However, you may need to manually exclude some scripts to avoid breaking key functionality on your site. For example, some navigation menus rely on JavaScript, so it would be important to exclude that script to avoid harming your visitors’ experiences.
Here are some plugins that can help you to optimize your site’s JavaScript:
- Autoptimize — a free option to defer JavaScript loading.
- Flying Scripts — a free option to delay JavaScript until user interaction.
- WP Rocket — a premium option that lets you defer or delay JavaScript according to your preferences.
- Perfmatters — another premium option that lets you defer or delay JavaScript according to your preferences.
Reduce DNS lookups
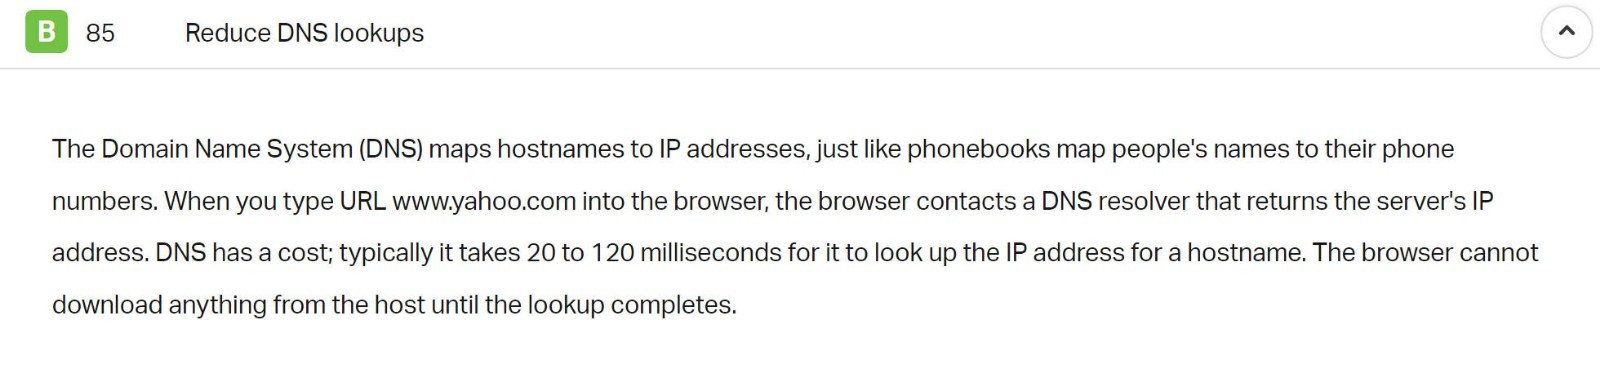
As with HTTP requests, each domain name your visitors’ browsers need to access adds time in the form of DNS lookups. DNS is ‘the phone book of the internet’ and it helps your browser to figure out the IP address behind a domain name.
For example, if you’re loading third-party scripts from Google Analytics and third-party font files from Google Fonts, those would add two additional DNS lookups.
Because each DNS lookup takes some time, this can slow down your site. You can see the exact time each DNS lookup takes in the Pingdom waterfall analysis — more on that below.
Here are some tips to reduce DNS lookups:
- Eliminate third-party resources when possible — try to avoid loading resources from third-party servers whenever possible. Basically, if it’s not adding a real benefit to your site, get rid of it.
- Load resources from your own domain or CDN when possible — instead of loading resources such as Google Fonts and Font Awesome from that resource’s domain, you can self-host the files on your own server or CDN, which will eliminate the need to make an extra DNS lookup. A plugin such as CAOS can help you to host Google Fonts locally.
- Defer or delay JavaScript — delaying JavaScript can reduce the number of DNS lookups needed to load the main content of your site, which will speed up perceived load times.
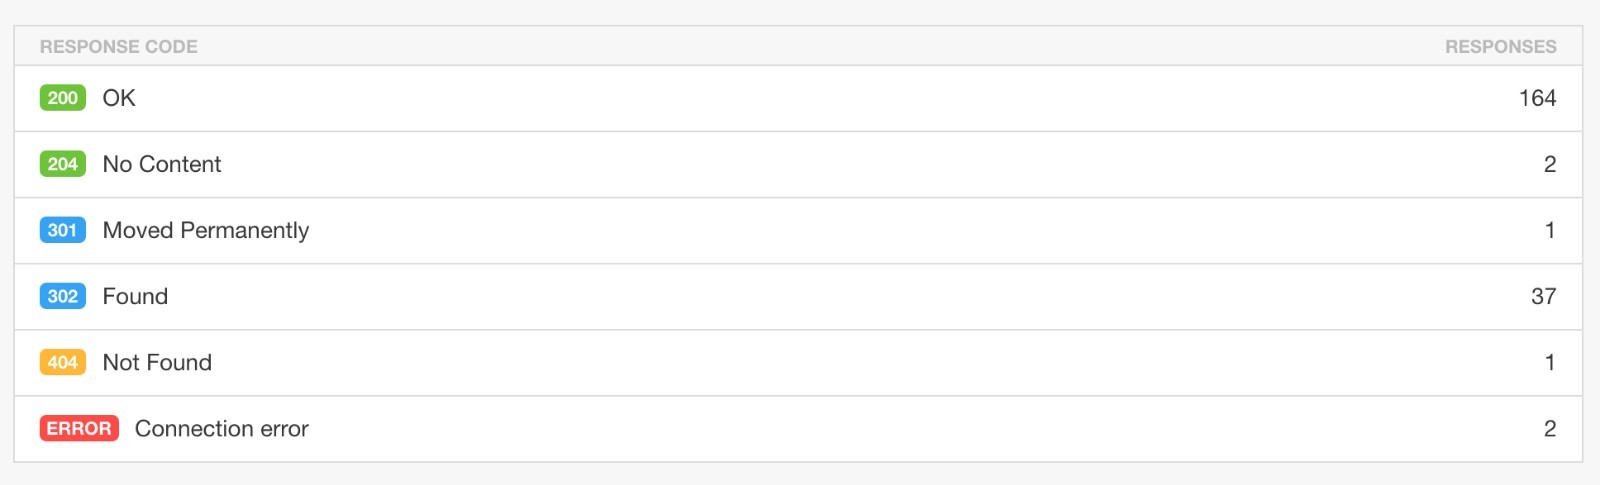
Response Codes
Below the suggestions to improve page performance, Pingdom has some additional information about what’s happening on your site.
The response codes section tells you what’s going on with all of the resources you’re loading on the page, and is especially useful if your website’s been up and running for a while. Response codes that are in the 200s or 300s are usually fine, but you’ll want to weed out all 400 and 500-class errors.
You can also use the waterfall (more on this in a moment) to figure out which resources are giving you 404 and 500 errors, and take the appropriate steps to remove them or modify your site.
Content and Request Breakdown
There are four tables that give you information about the distribution of your content and your requests.
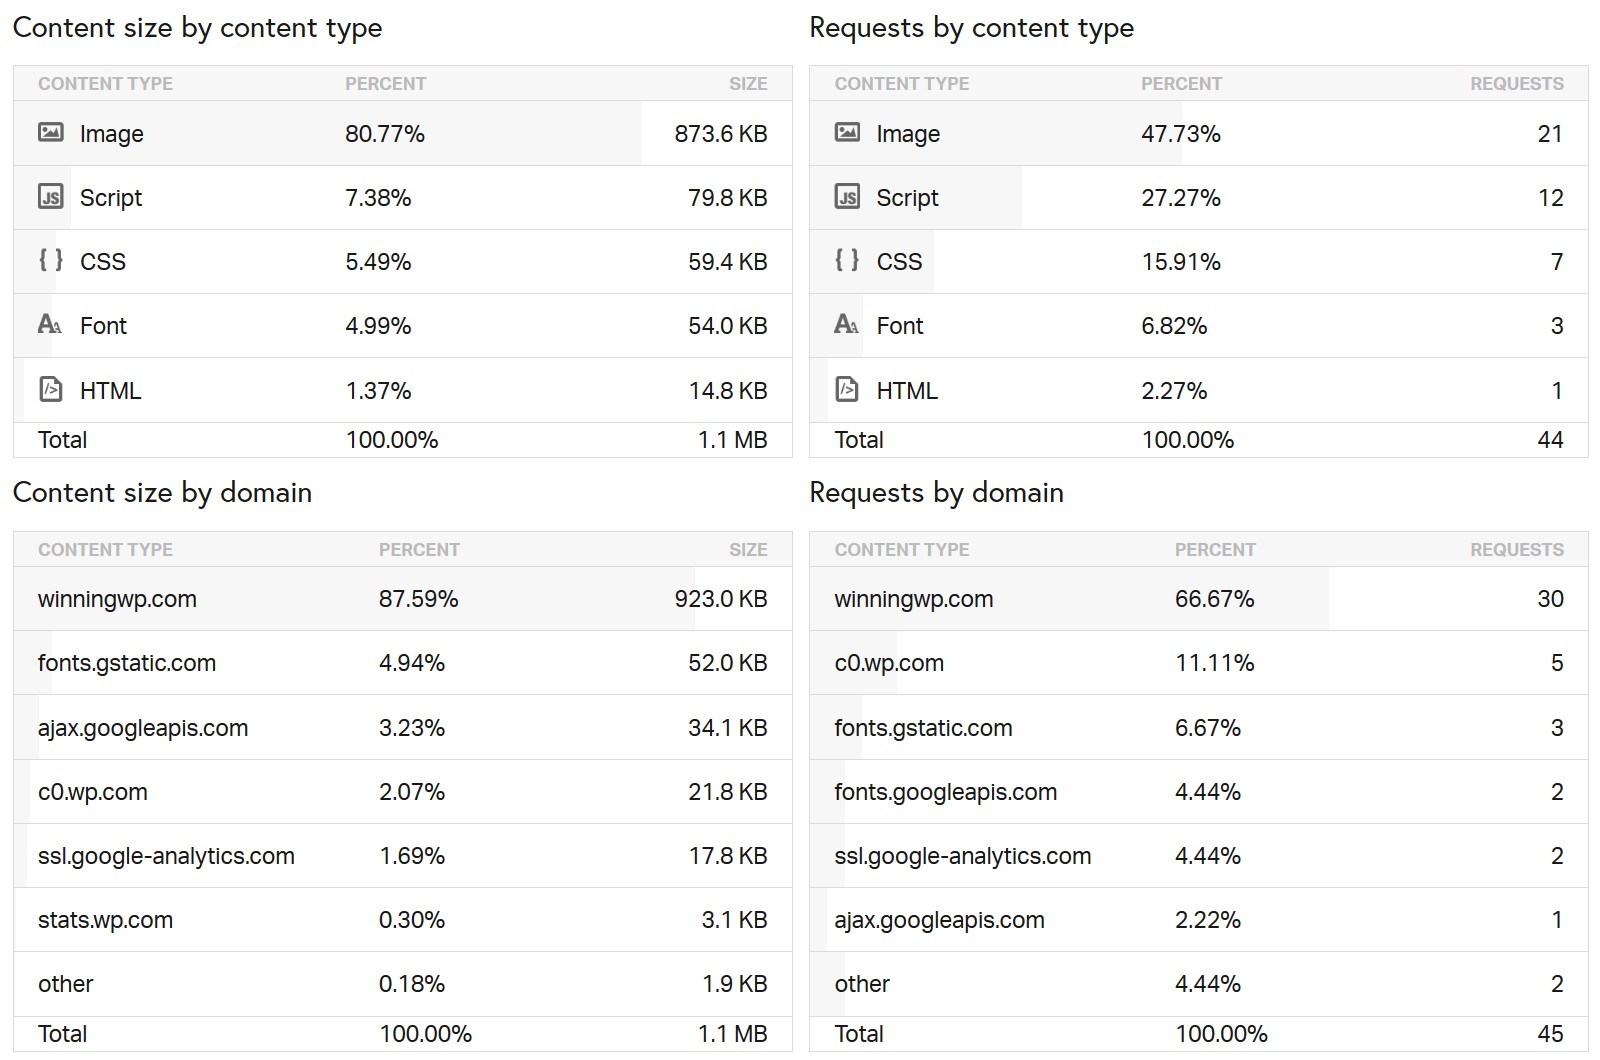
Content size by content type lists all of your assets grouped together by type — images, scripts, CSS, HTML and so on — and you can use this information to weed out any obvious issues. Loading 20MB of images on a page usually means you should optimize your images; loading 2MB of JavaScript means you need to be more efficient in your use of scripts.
The requests by content type table shows the number of requests your site is making. As I covered earlier, you want to try to get rid of as many unneeded or slow-loading requests as possible. However, it’s no longer best practice to combine scripts unless your host still uses HTTP/1 (which is rare these days).
Content size by domain and requests by domain show similar information regarding the origin of your content, and let you quickly see how much external content you’re loading on your site.
You want to load content mostly from local sources or from a CDN. If you load a lot of content from off-site sources, you may risk slowing down your site if it has to wait for the slow responses of others.
This analysis area can also help you to reduce DNS lookups, because each domain you’re able to eliminate will remove a DNS lookup.
File Requests (Waterfall Analysis)
Pingdom’s waterfall analysis (the file requests section) shows a deeper look at every single HTTP request on your site. For example, if you saw 45 HTTP requests in the summary box at the top, this section will have 45 entries, one for each HTTP request.
This tool is used by developers to gain a visual understanding of how a site loads and where the bottlenecks are. It shows a wealth of information, especially if you use the expander arrows to get to the details of each request.
You can learn not just how many HTTP requests your site has, but also which HTTP requests take the longest (and are therefore having the largest effect on your site’s performance).
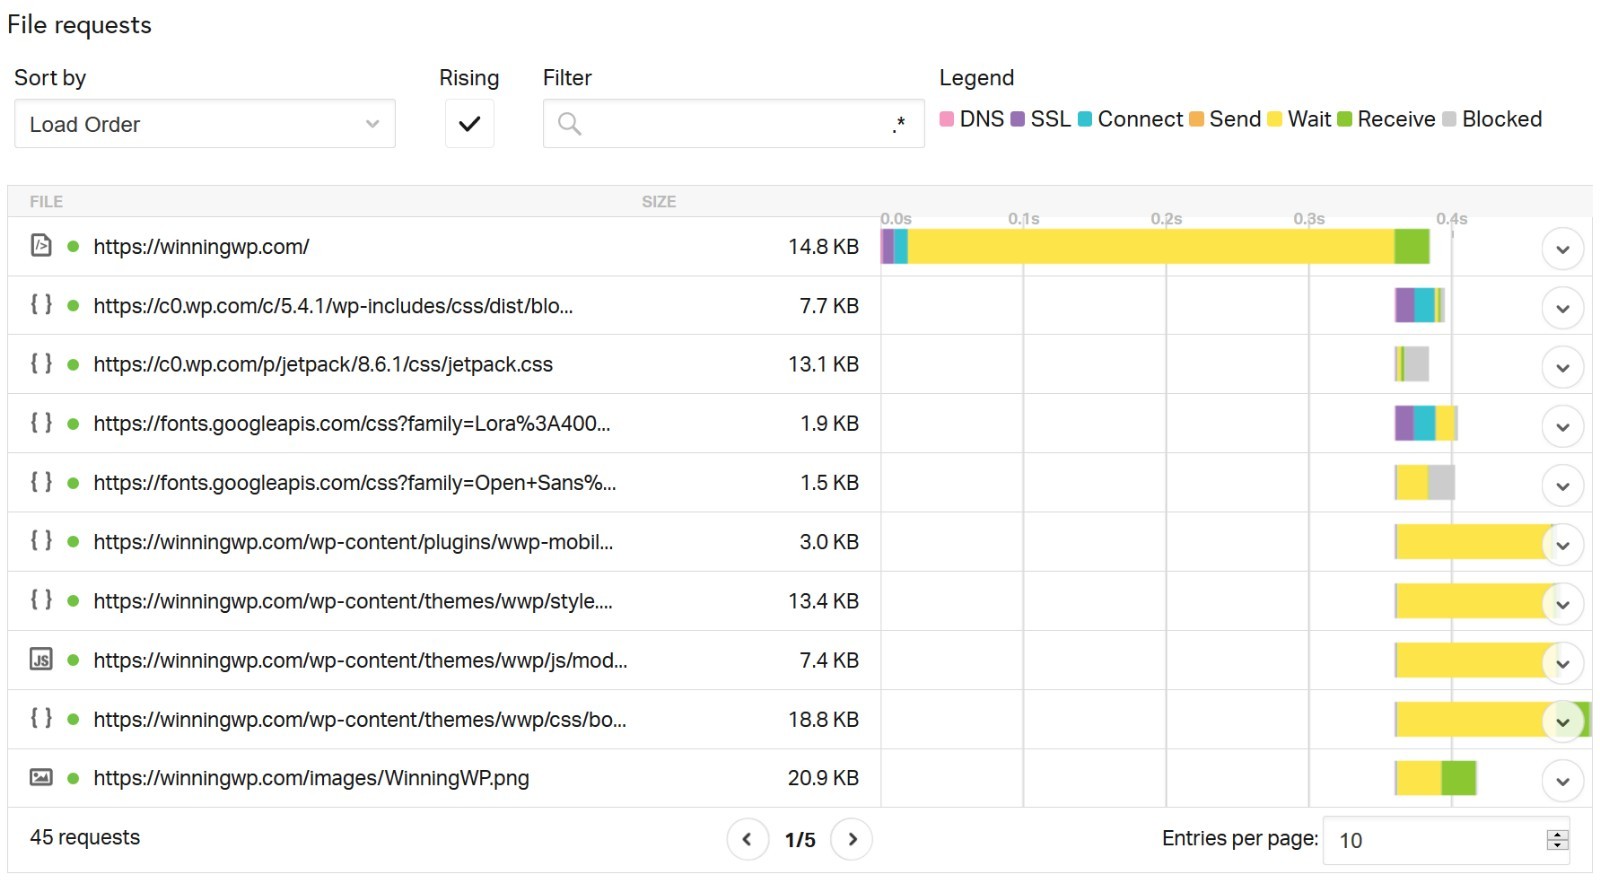
The icon on the left indicates the type of content being requested. If the response isn’t of the 200 class, you’ll see an alert icon — hover over it for more information. Next comes the request URL and the request size. Finally, there’s a horizontal bar graph that shows you when and how the resource loaded.
The further to the right the bar starts, the later the resource loads. The length of the bar shows the loading time, broken down into:
- DNS
- SSL
- Connect
- Send
- Wait
- Receive
- Blocked
For local resources, it’s a good idea to keep an eye on the connect sizes. Lengthy connect times can indicate a problem with your host — assuming your site is otherwise well-configured. Search for long bars that hinder the loading of your website, or external resources with a lengthy DNS or other metric — these should be weeded out.
If you’re using WordPress, another use for this tool is to discover plugins or themes that are slowing your site down — you can use the search box at the top to search for specific ones. For example, to find all of the assets the Avada theme uses, you could search for Avada:
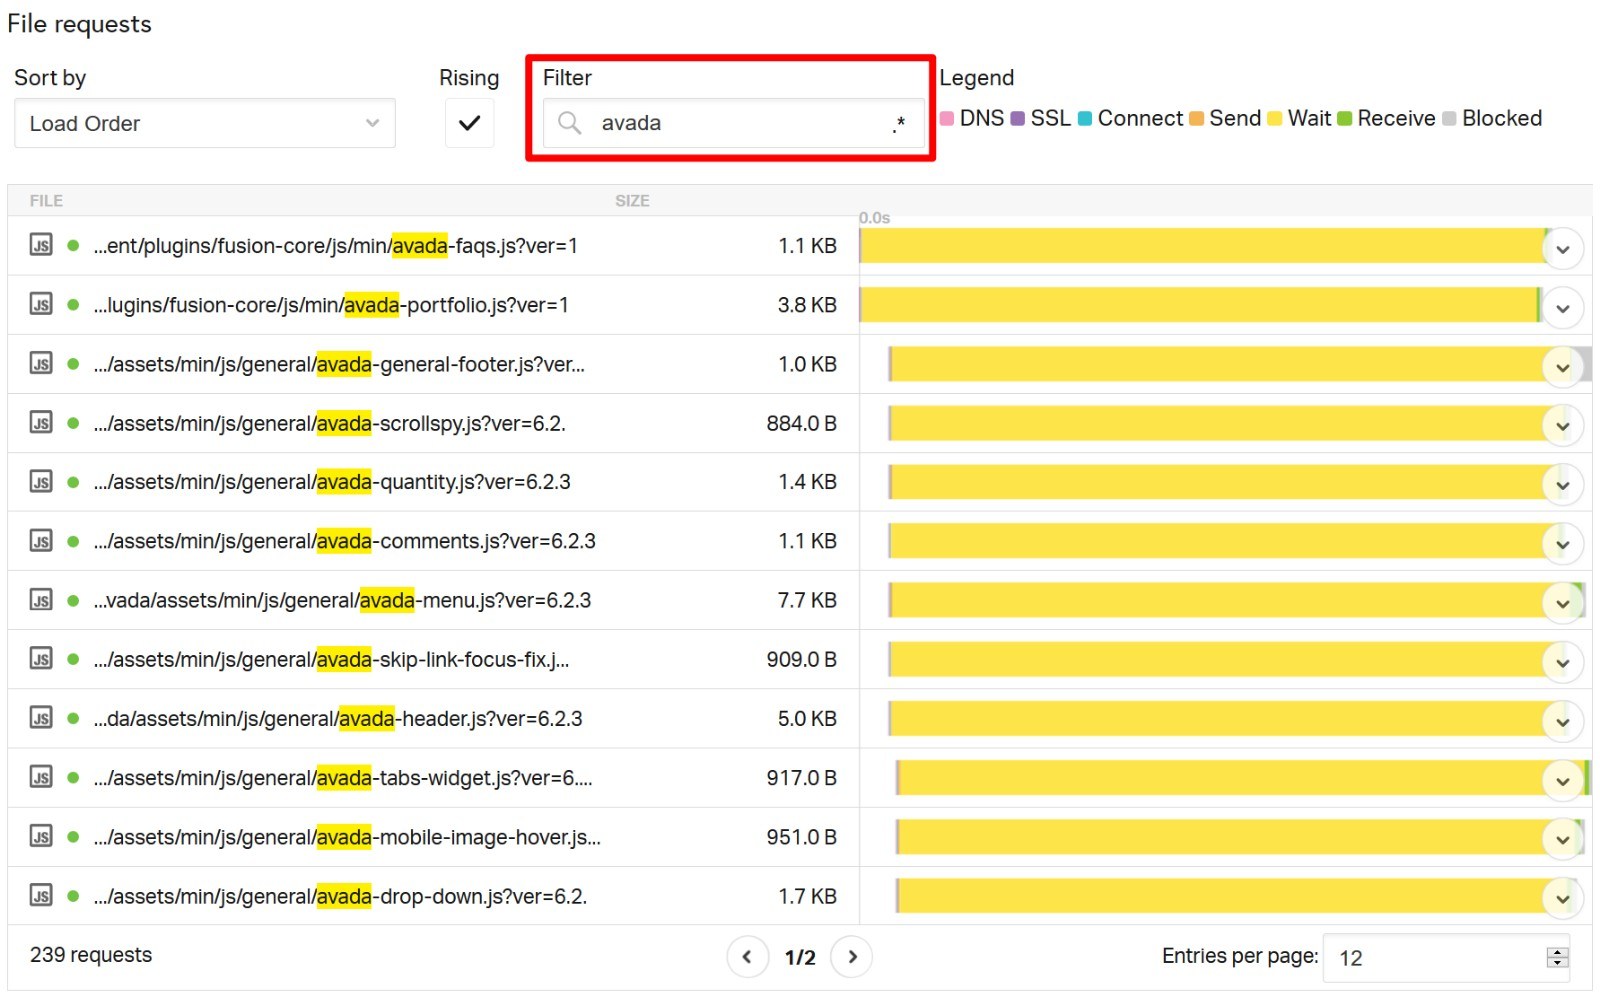
If a plugin or theme has tons of slow-loading requests in the waterfall analysis, it could indicate you should try to get rid of it or swap it for a more performance-optimized alternative.
👉 What to Do If Your Site Still Loads Slowly
If you’ve followed all of the tips above and you’re still not happy with your site’s performance in Pingdom, that may mean your web host just isn’t up to the challenge.
Optimizing your site’s front-end performance with Pingdom can speed it up, but you’ll still always be limited by your back-end performance (i.e. your hosting).
To create a really fast site, you need to nail both the front-end and back-end performance.
To find some quality hosting options at all price points, you can read our guide to the best WordPress hosting.
Limitations of the Free Pingdom Speed Test Tool
Here’s a quick summary of the main limitations of the free speed test tool:
- Provides limited performance data, with no support for Core Web Vitals.
- Only tests from a desktop device. Mobile performance is important in this increasingly mobile-first world.
- Doesn’t let you adjust the connection speed.
- Has some outdated suggestions in the improve page performance section, such as only checking for Gzip compression and ignoring Brotli.
Because of its easy-to-use interface, Pingdom is an excellent tool if you’re just getting started with analyzing your website’s performance.
However, as your understanding grows, you should know it does have some notable limitations when you compare it to other tools, such as GTmetrix or WebPageTest.
We already covered one — Pingdom only gives you the onload time for your ‘load time’, whereas GTmetrix and WebPageTest both give you multiple metrics (including onload time). This is why your site will often load ‘faster’ when you test it in Pingdom.
Pingdom also lacks any information on Core Web Vitals metrics such as Largest Contentful Paint, which is a bit of a bummer since Google has put such an emphasis on it. If you want access to this type of data, you may prefer one of the Pingdom alternatives that we’ll discuss later on.
Second, the free speed test only tests using a desktop device. This only gives you a partial picture because more than half of all internet traffic is now on mobile devices. Because of certain factors, such as how much longer it takes a low-powered smartphone to render JavaScript, your site will load differently on desktop vs mobile. To fully understand your site’s performance, it’s important to test both desktop and mobile load times, so you’ll need to use another tool for mobile speed tests.
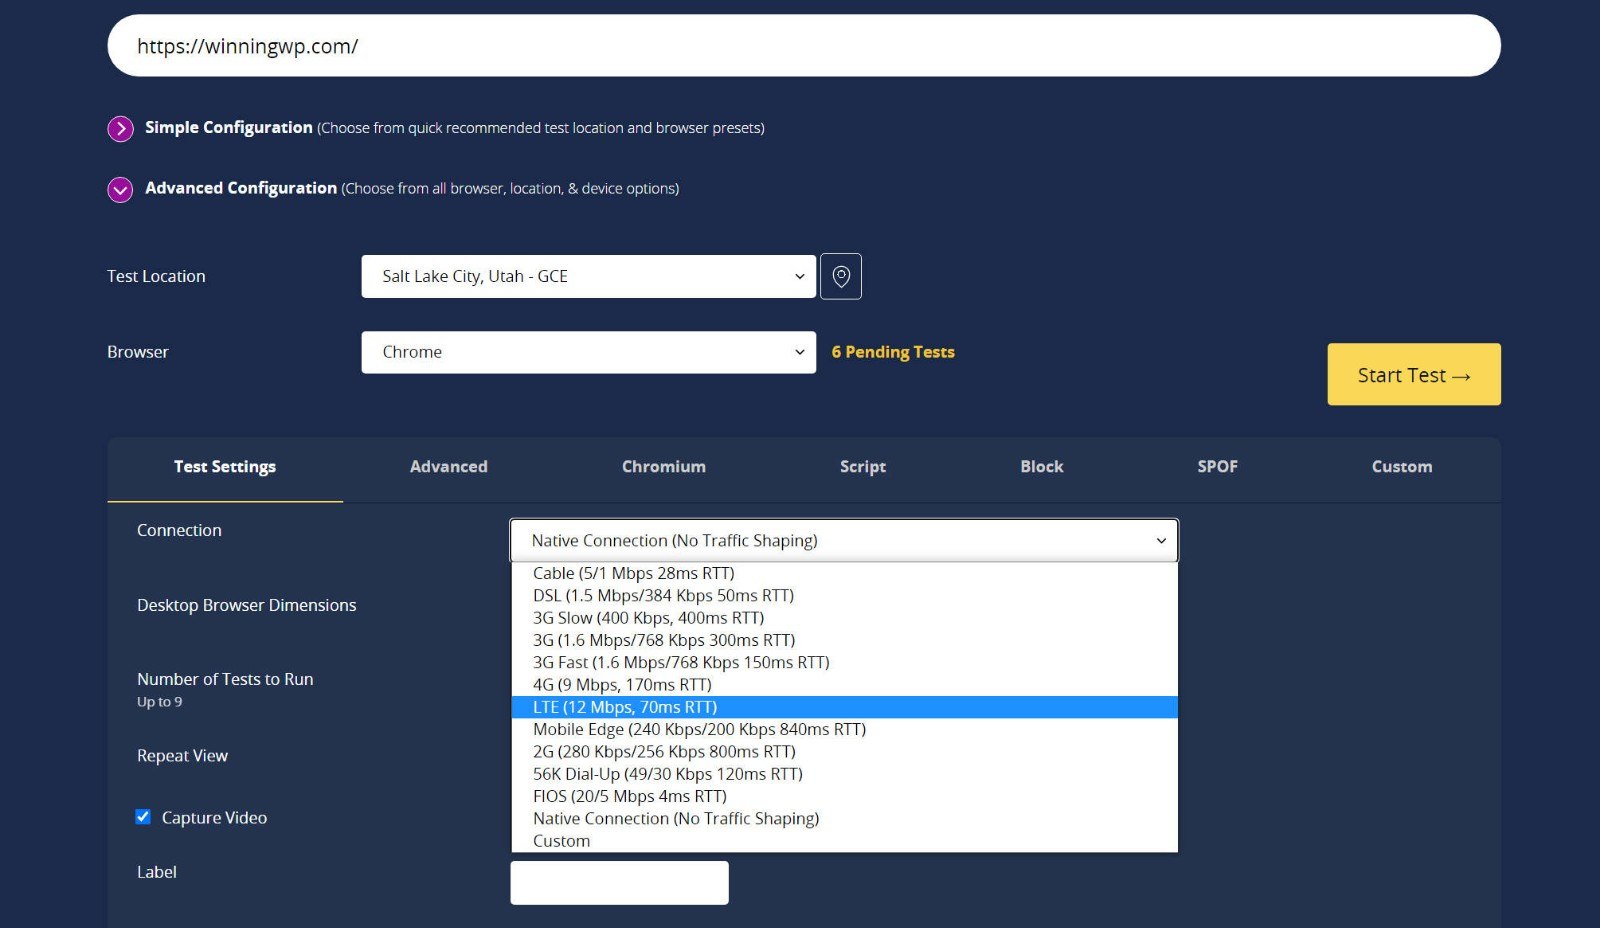
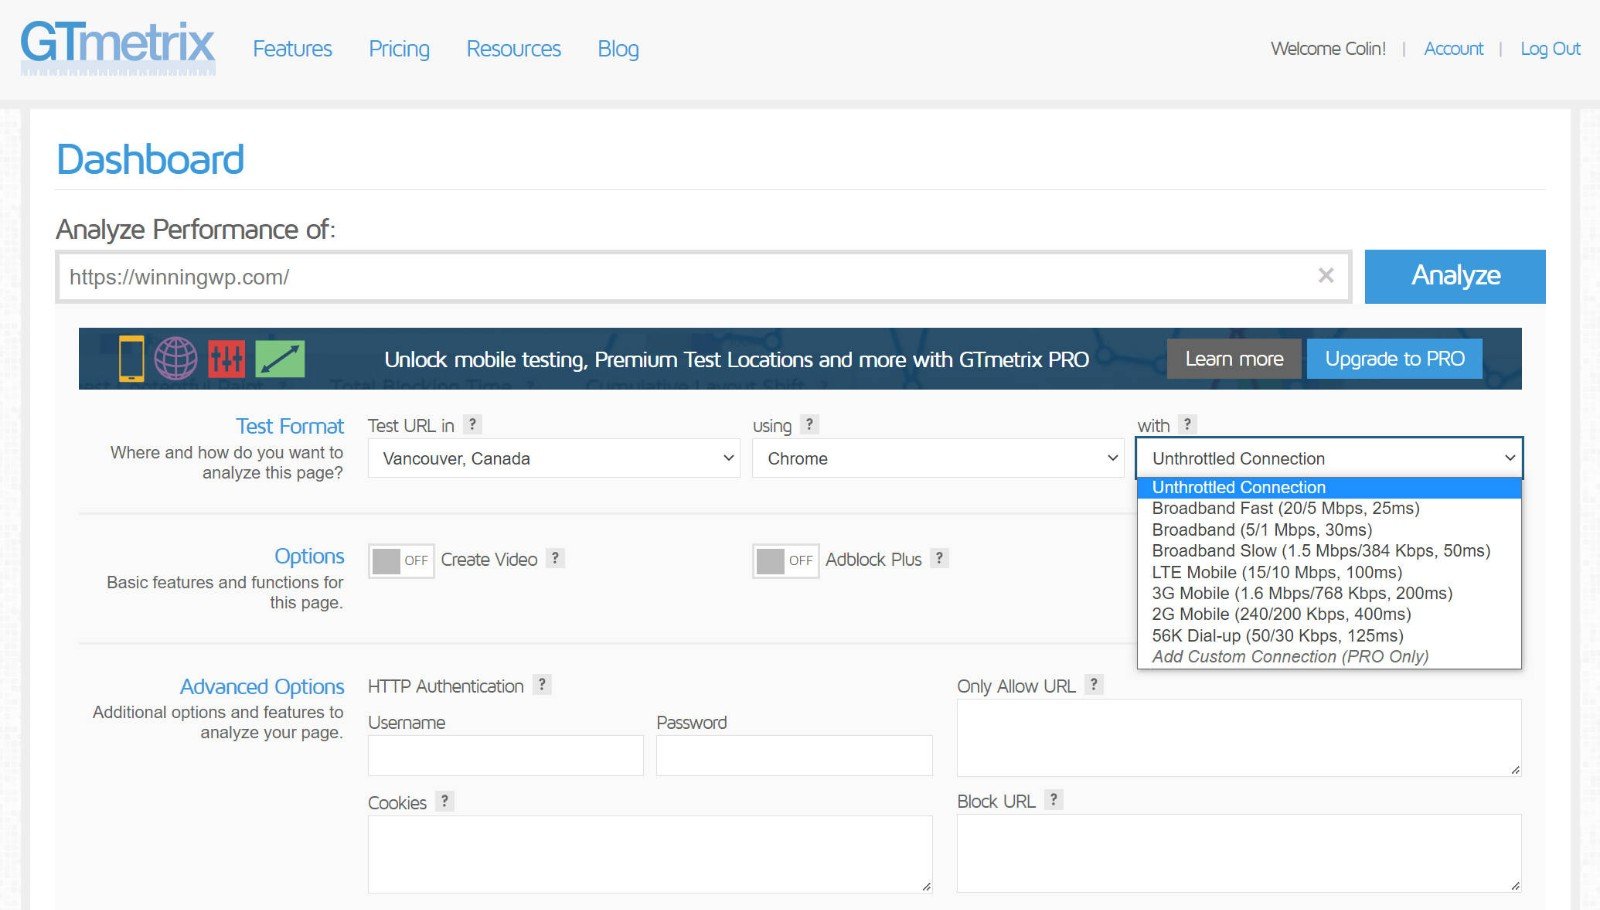
Finally, Pingdom doesn’t let you adjust the connection speed. In the real world, each visitor will have a different connection speed — for example, someone who’s tethered to their smartphone’s 3G will have a slower connection than someone with an ultra-fast wired connection.
Pingdom uses an ultra-fast connection for all of its tests, which is another reason why your site will load ‘faster’ in Pingdom. However, to get an accurate picture, you’ll want to test your site with different connection speeds, which both GTmetrix and WebPageTest allow. For example, look at all of the connection speed options WebPageTest gives you:

Overall, Pingdom’s free speed test tool is certainly useful, especially for casual users. However, advanced users may appreciate the additional flexibility of tools such as GTmetrix and WebPageTest for free performance analysis. We’ll dig into these tools in more depth a bit later in this post.
Or, you can use the paid version of Pingdom to solve a lot of these weaknesses. Speaking of…
Premium Pingdom Features — These Are Where Pingdom Stands Out
While the free version looks nice, it’s a little bit more limited than both GTmetrix or WebPageTest, as we discussed above.
However, when you grab a pro account, Pingdom becomes a powerhouse of handy features. Let’s take a look at all you can do with the premium Pingdom features.
💡 Tip: You can test all of these features with a 30-day free trial (and without needing to enter your credit card). Even if you decide not to keep paying after the free trial, the information you’ll gain during this time will already be quite valuable.
Uptime Monitoring
Uptime monitoring (your host may not be as reliable as you think) is the most basic type of monitoring Pingdom offers. It consists of a graph that combines the average response time with any downtime your site may experience.
Below the chart, Pingdom will also list each downtime event and its duration:
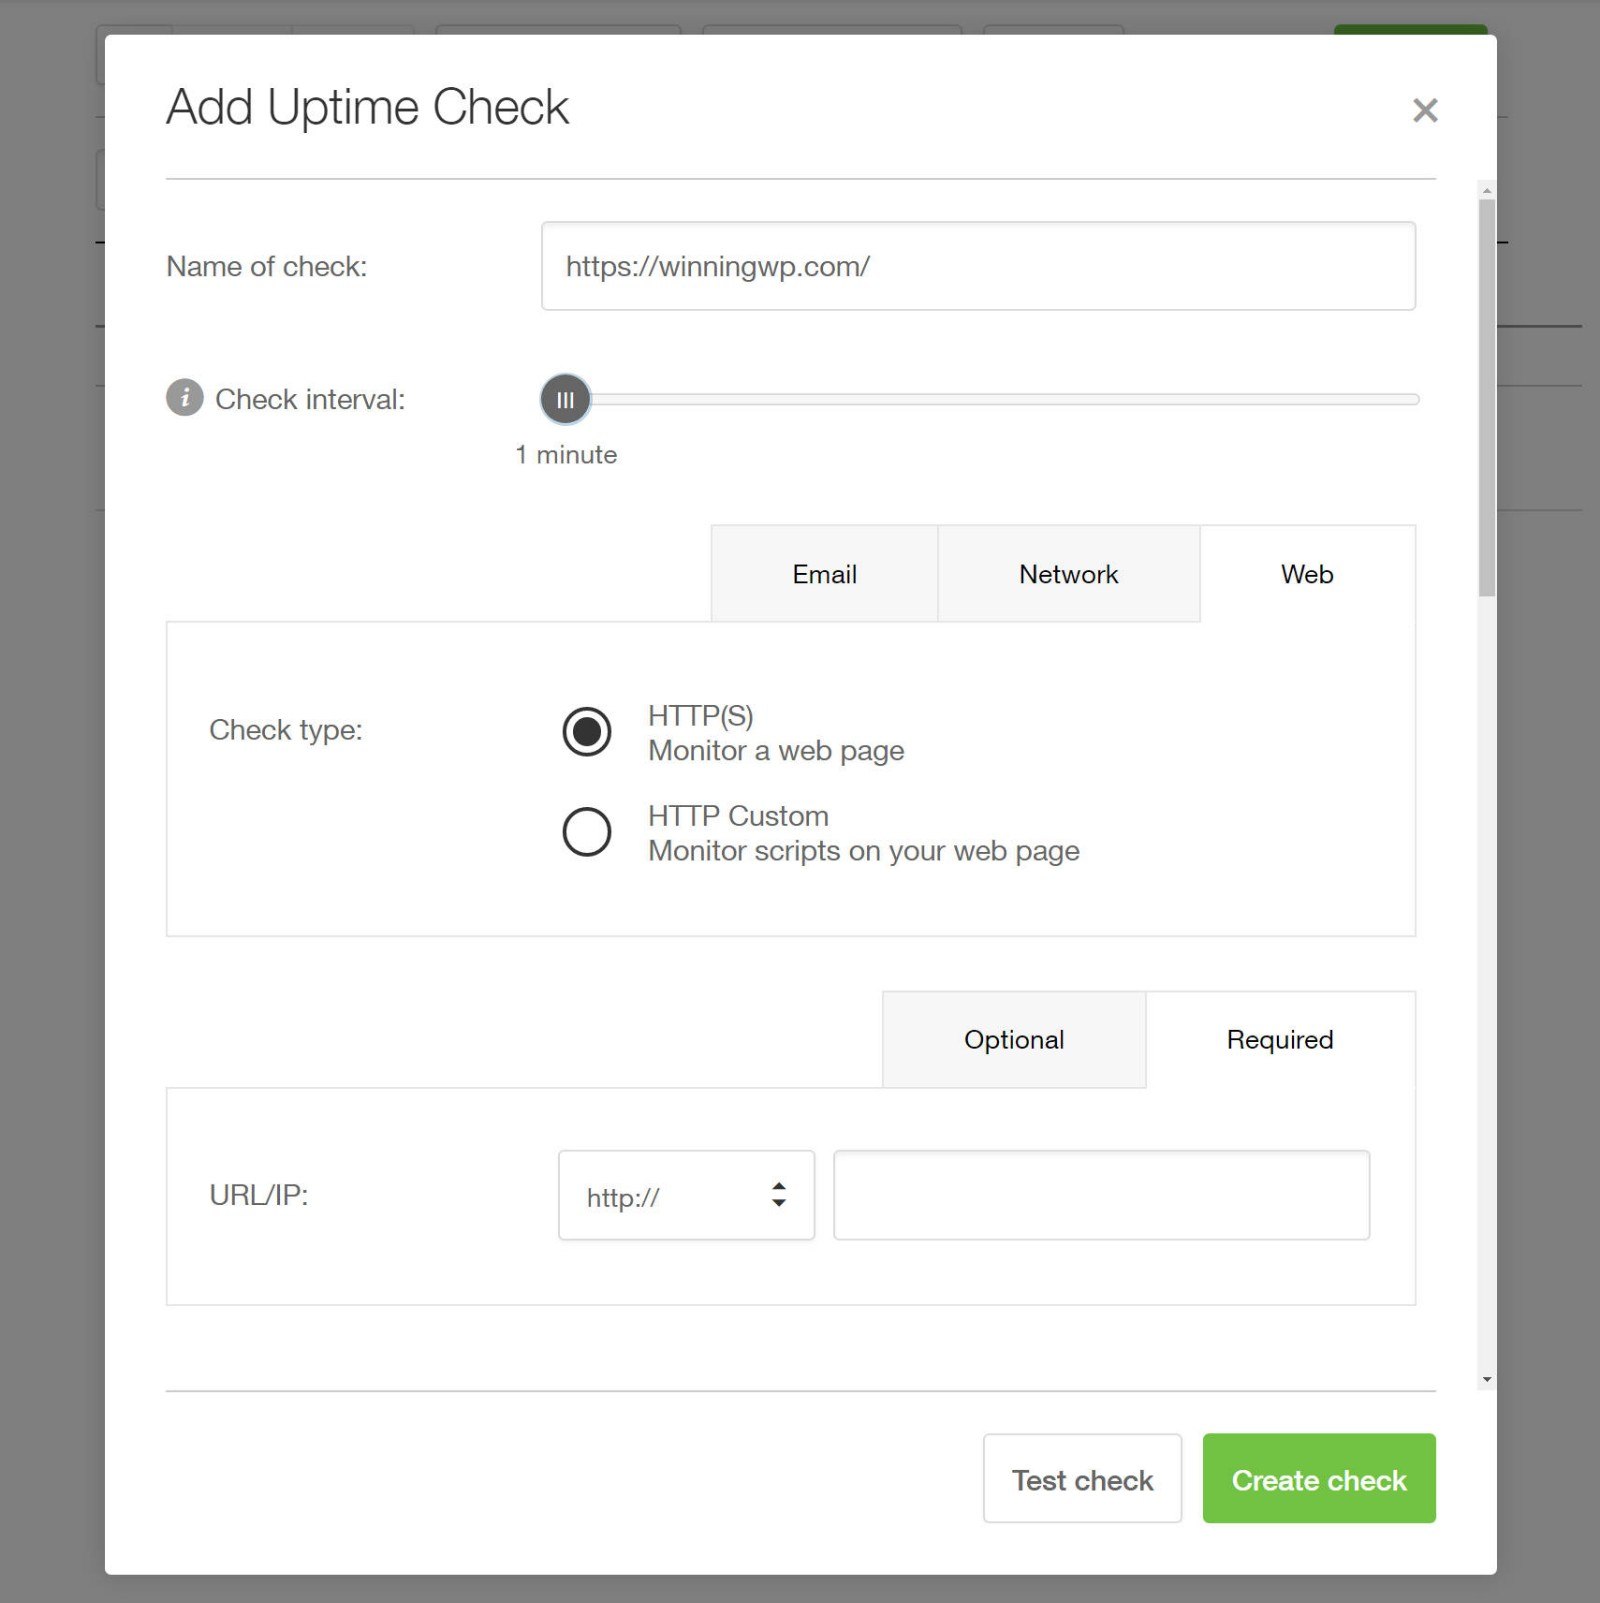
You can also set up real-time alerts if your site goes down. You can receive alerts via email and send alerts to different people depending on the issue.
When you add an uptime check, you can choose your own check interval from between one minute and 60 minutes. For example, if you set it equal to one minute, Pingdom will check your site’s uptime every minute.
Page Speed Reports
Page speed reports are the same as the free tool on the site combined with historical data — excellent for catching nasty trends or code-related slowness. By default, Pingdom automatically tests your site’s performance every 30 minutes, so this data comes from 48 checks per day.
This will give you lots of data points, and it also lets you see how your site’s page load times change during the day. For example, you may find your site drags a bit during peak hours or when your security plugin runs its automatic daily scan.
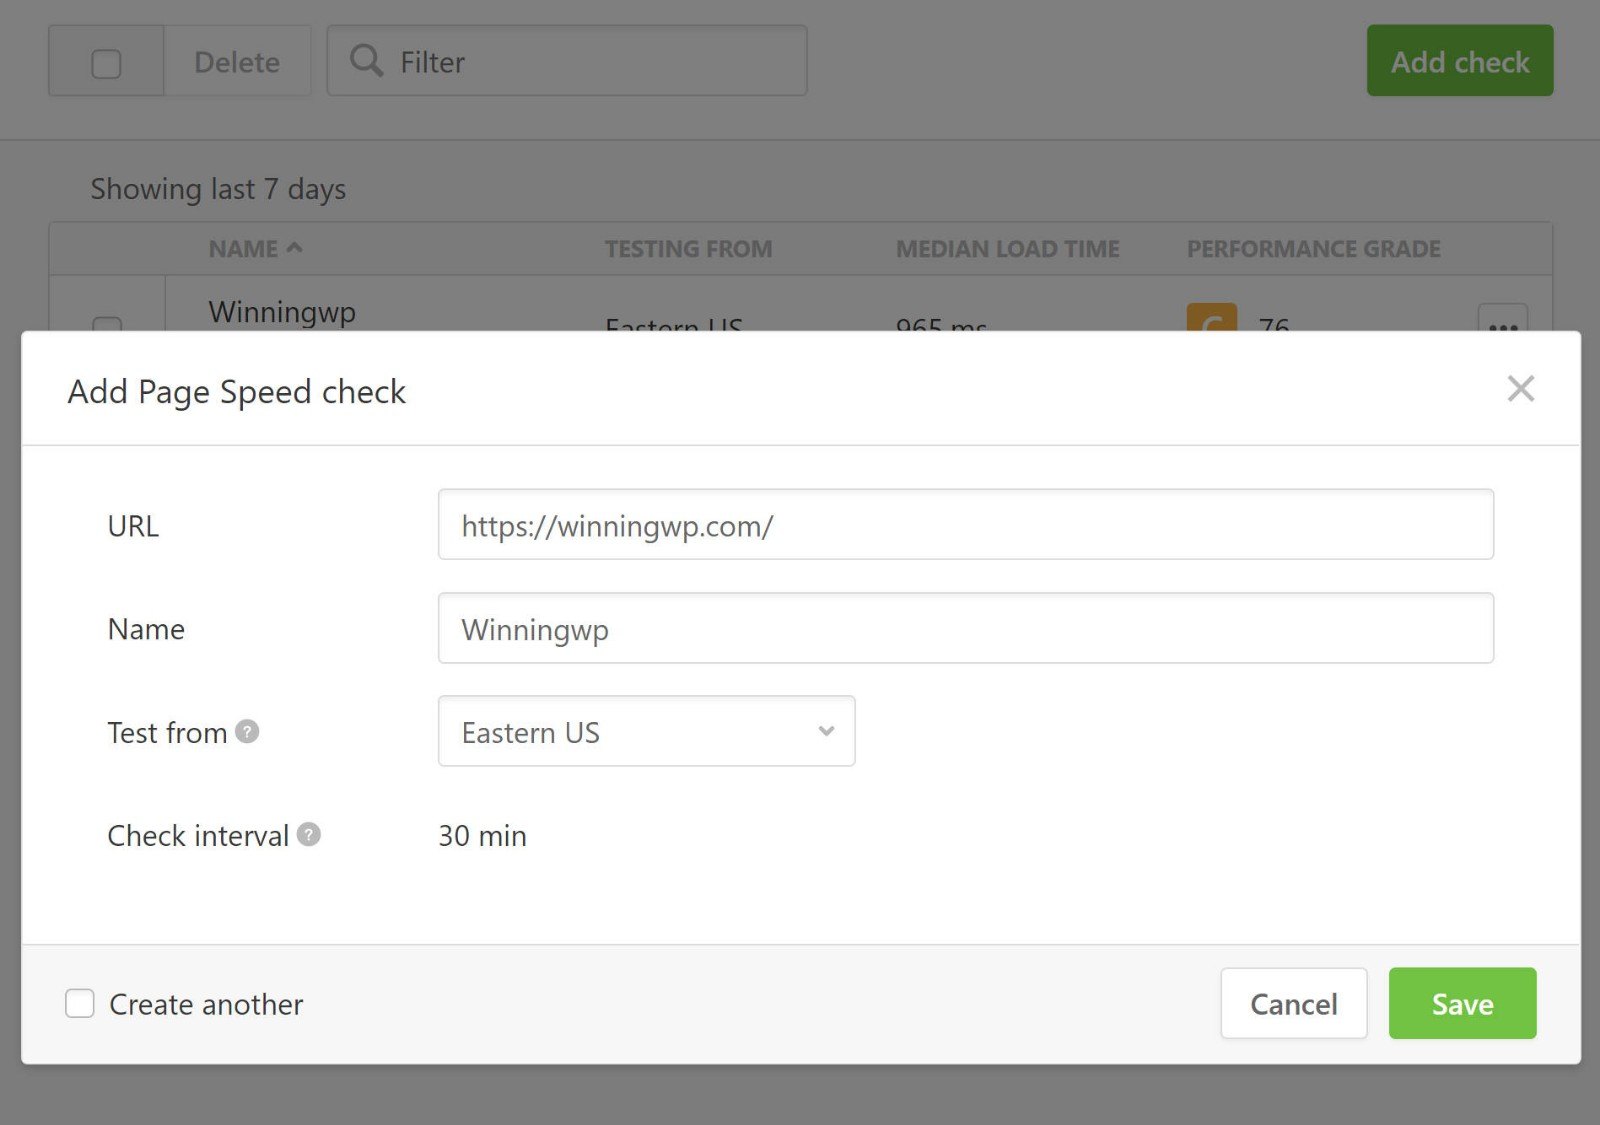
If you want to test different pages or from different locations, you can set up multiple alerts.
Transaction Reports
Transaction reports are one of Pingdom’s most powerful features. They allow you to make sure user interactions spanning multiple actions and pages work smoothly, and are invaluable for eCommerce, SaaS applications and other interaction-based sites.
For example, you can set it up so Pingdom can monitor your eCommerce store’s checkout process. If there’s a problem, you can be alerted right away, so you don’t lose revenue.
The idea is to use a simple editor to tell Pingdom how to navigate your site and how to check the results. You could instruct Pingdom to load your homepage, check that it gives a 200 status code, fill in a search field and then go to a result.
If you have some development knowledge, you can set up transaction sequences using a back-end editor. As you go, Pingdom will suggest actions to track based on your actual website. For example, on WinningWP it automatically scans every link, so we can track clicks as a transaction:
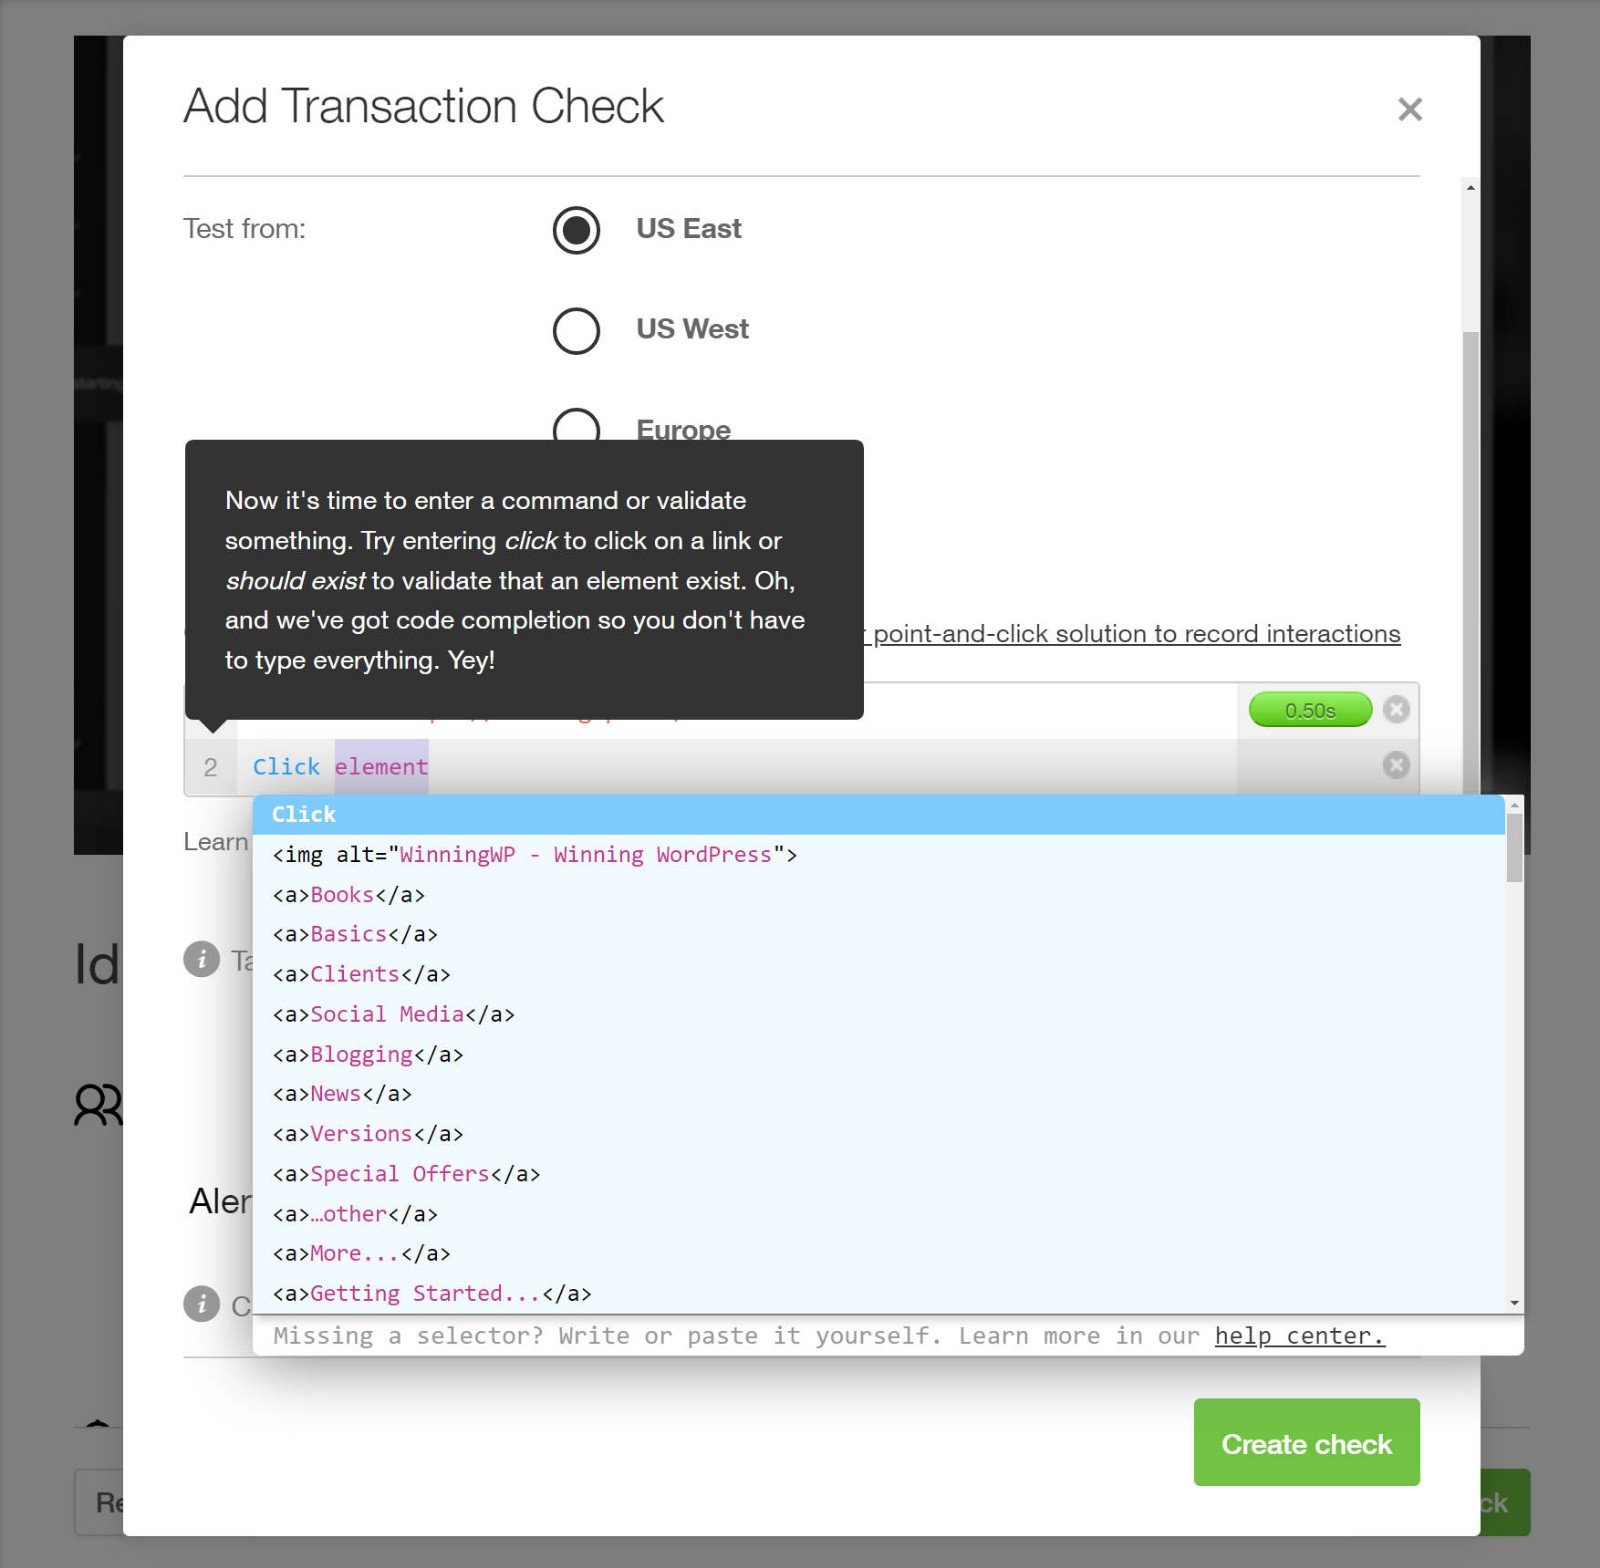
For casual users, Pingdom also includes a really cool tool that lets you record transaction sequences using a point-and-click solution.
Note: Pingdom has an excellent tutorial video on transaction reports and how to set them up.
Visitor Insights (RUM)
Page speed tests tend to be artificial. You load your website in your browser, or you initiate a test using an external service such as Pingdom. These are great and mostly follow what actually happens in reality — although not always.
Visitor Insights, part of Pingdom’s Real User Monitoring solution, gives you a bit of code to add to your site — just like Google Analytics. Once added, you’ll see real data rolling in — you’ll see how long it took for your site to load for actual visitors, as opposed to you or some automated bot.
Real data will give you insight far beyond the available test locations, since your visitors will come from all over the world. You can set the load time conditions for satisfied, tolerating and frustrated visitors to segment your view better.
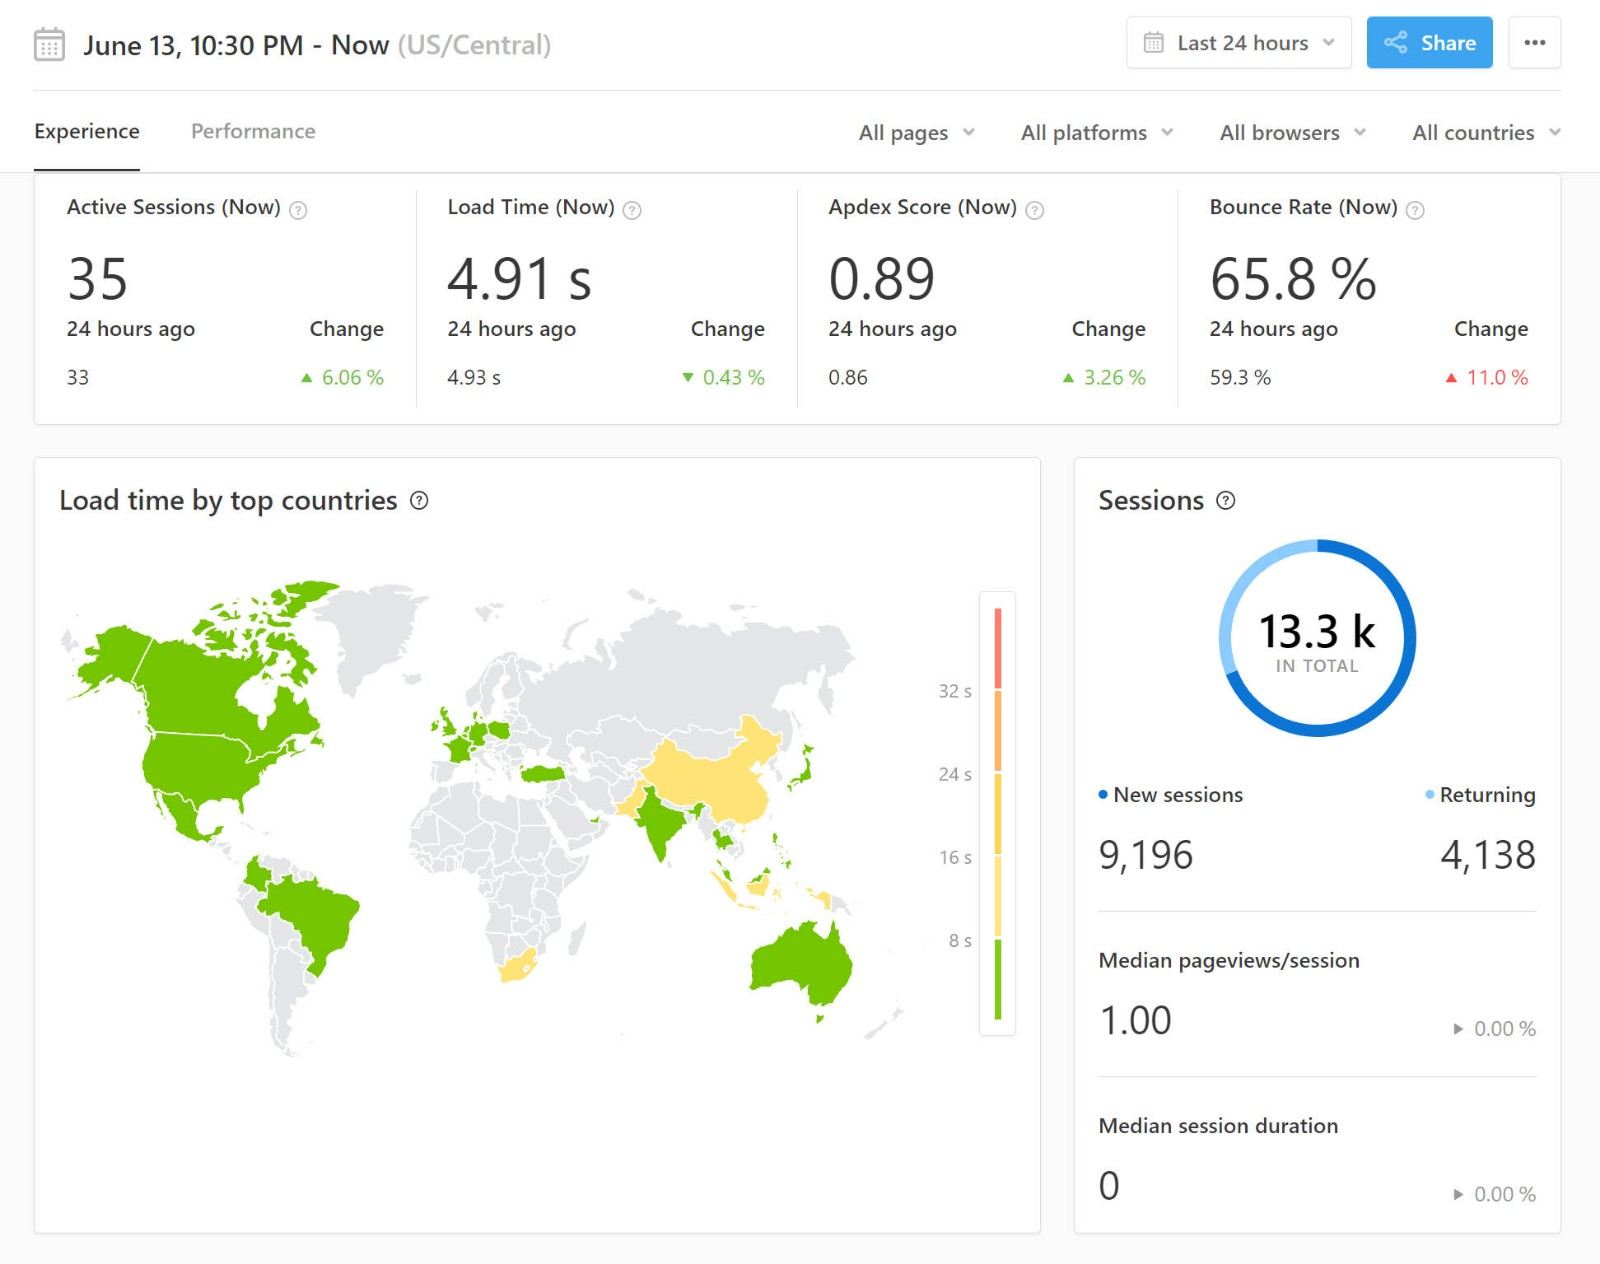
By collecting this real data, you can overcome a lot of the limitations of Pingdom’s free tool. You’ll be able to see how your website loads for visitors from different locations, using different devices, and with different connection speeds.
Putting all of those variables together means you can get a really accurate picture of your site’s real-world load times.
Alerts
Pingdom offers you a basic alert system out of the box. You can get emails, basic app notifications and SMS messages, and your alerts will come within minutes.
Pingdom also has built-in integrations for certain apps, such as Slack, and you can also set up your own integrations with Webhooks, such as using Zapier and Webhooks to connect to any app.
If you’re working as a team, you can also add multiple team members, each with different alert policies.
Basically, all of these options make it easy to quickly get notified if something goes wrong, such as downtime or an issue with a transaction you’re monitoring.
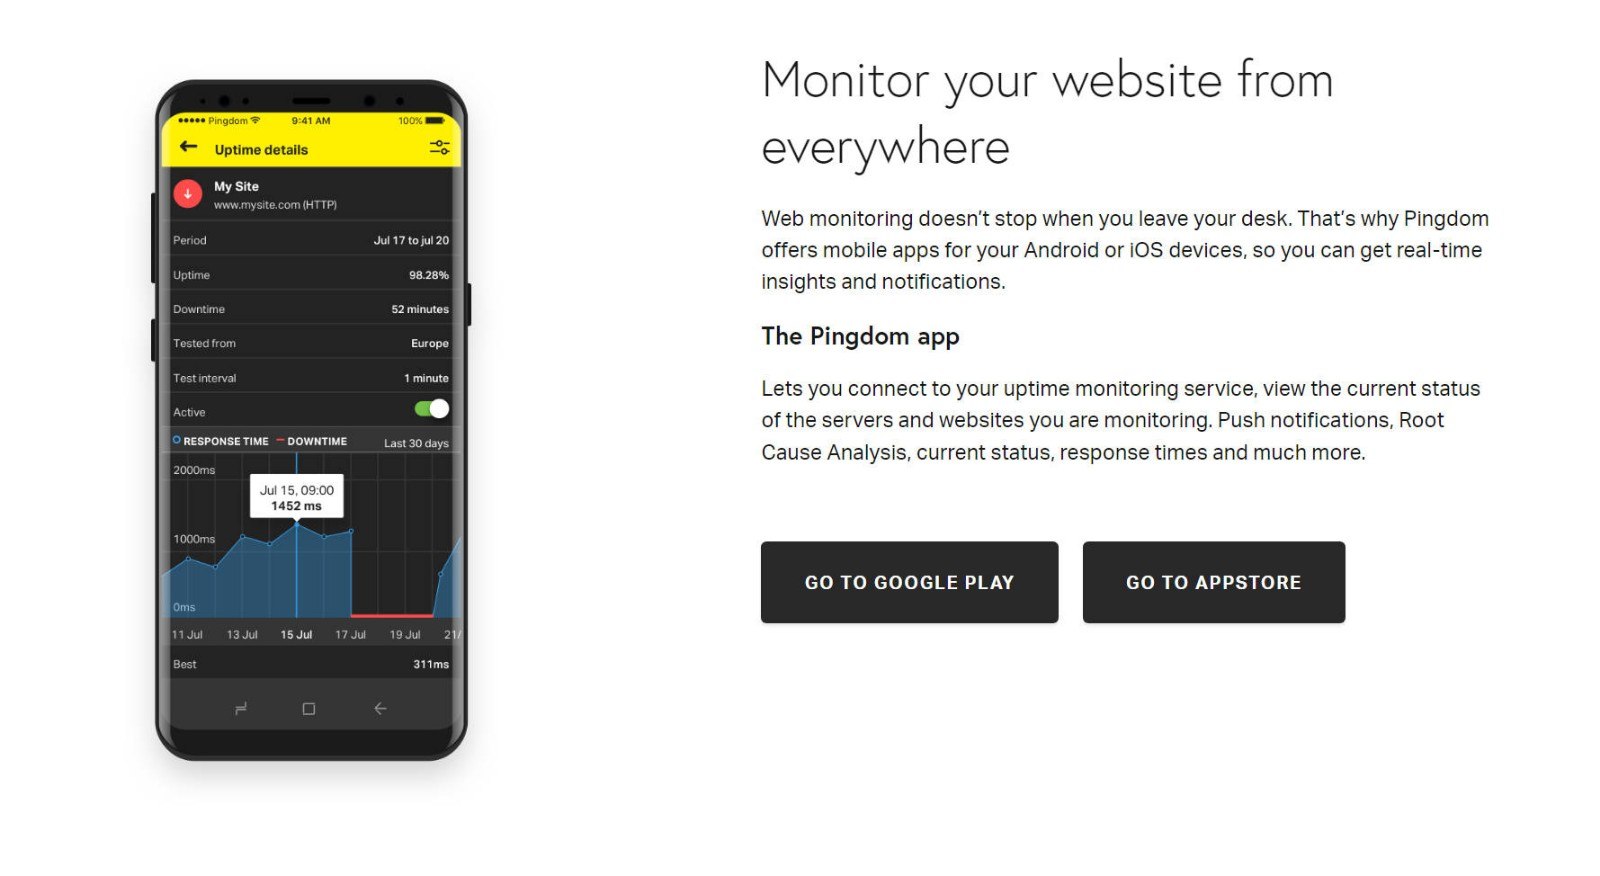
The Pingdom Mobile App
Pingdom has an extremely handy free mobile app (available for both Android and iPhone) that lets you monitor your site’s uptime and performance while on the move,
Pingdom Pricing
First off, as I’ve mentioned a few times already, Pingdom offers a 30-day free trial that lets you test everything (no credit card required).
After that, Pingdom offers two paid services, each of which has scaling prices depending on your usage:
- Synthetic Monitoring — this includes transaction monitoring, page speed monitoring (via Pingdom’s tests) and uptime monitoring. Basically, all of the ‘lab’ tests.
- Real User Monitoring (RUM) — this is what lets you see the actual load times your real human visitors experience.
You can choose to use one or both of them, depending on your needs.
Each service starts at $10 a month, and the price scales up from there based on the following metrics:
- Number of checks for Synthetic Monitoring.
- Monthly page views for Real User Monitoring.
To calculate the exact price for your needs, you can use the following calculators:
The 30-day free trial includes access to both Synthetic Monitoring and Real User Monitoring.
Four Quality Pingdom Alternatives for Speed Testing
While Pingdom gives you a lot of options for testing, monitoring and improving your site’s performance, it’s far from the only option in that category.
Here are some other helpful Pingdom alternatives that you can use to supplement or replace Pingdom, depending on your needs.
WebPageTest
- 👍 Provides more performance data, including Core Web Vitals lab and field data.
- 👍 Highly configurable — choose different locations, speeds, devices, and more.
- 👍 Run multiple tests at the same time — up to nine.
- 👎 While the interface has improved a lot, the waterfall analysis still isn’t as nice as Pingdom.
- 👎 No real user monitoring or uptime monitoring as Pingdom’s paid tools offer.
WebPageTest is my personal favorite speed test tool because of how configurable it is.
Whereas the free Pingdom speed test tool gives you very little flexibility when it comes to testing from different devices or with different connection speeds, WebPageTest gives you very granular control over those details for free.
When you set up a test you can choose from different locations, devices (real device testing or emulation), connection speeds, and more.
It also lets you automatically run up to nine separate tests at once, which is great for eliminating single-test variability and making sure you’re getting meaningful data.
Overall, if you’re specifically looking for a free speed test tool, I’d say WebPageTest is a better option than Pingdom. The one drawback is WebPageTest’s waterfall analysis is pretty bad — Pingdom’s waterfall interface is much nicer and easier to use effectively.
Additionally, WebPageTest can’t match the premium tools Pingdom offers, such as automated monitoring and real user monitoring.
GTmetrix
- 👍 A bit more configurable in the free version.
- 👍 Includes Core Web Vitals metrics.
- 👍 Allows basic performance monitoring for free.
- 👎 No real user monitoring.
GTmetrix is another popular free speed testing tool that gives you a little more flexibility than Pingdom in some areas.
For example, you can change the connection speed using the free testing tool (and the Pro version adds more options such as real mobile device testing).
It also gives you more data, including Core Web Vitals metrics such as Largest Contentful Paint. Plus, you’re able to set up daily performance monitoring even with the free version (though you can only run one test per day unless you pay).
Unlike WebPageTest, GTmetrix also includes a very user-friendly waterfall analysis tool that can rival Pingdom’s waterfall.
If you want to learn more, check out our full GTmetrix guide.
PageSpeed Insights
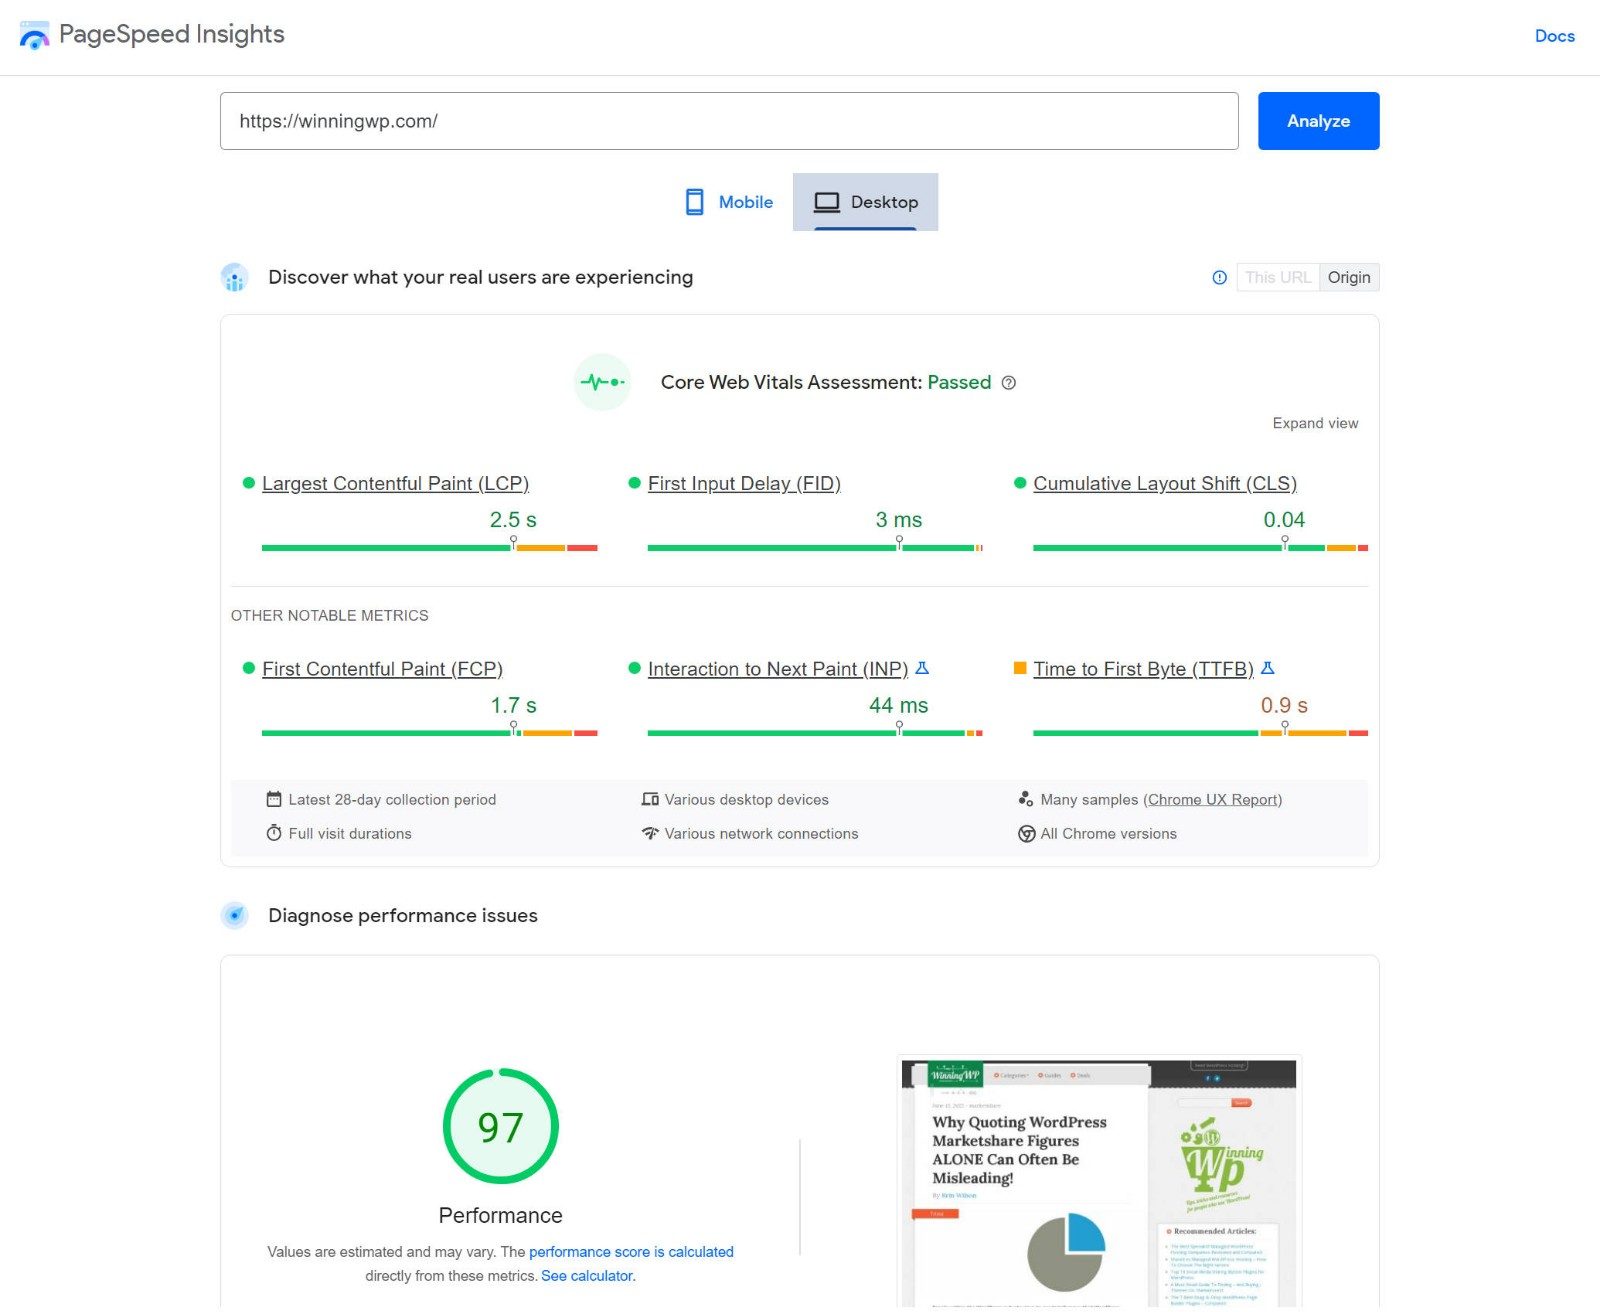
- 👍 Offers both lab data and field data based on real users (if your page has enough traffic to be in the Chrome User Experience Report).
- 👍 Offers tons of analysis options to improve your performance.
- 👍 Tests both mobile and desktop.
- 👎 No configuration options. For example, you need to use a VPN to test from a different location.
- 👎 No options for automatic monitoring.
PageSpeed Insights is the official free performance testing tool from Google.
It used to only give you an abstract score, but it now gives you tons of real data about your site’s performance, including the Core Web Vitals metrics such as Largest Contentful Paint.
It also provides lots of analysis and suggestions to improve your performance, even tailoring its suggestions to the specific situation on your site. For example, instead of just telling you to ‘move JavaScript to the bottom’ as Pingdom does, PageSpeed Insights will actually list the real JavaScript files that are causing issues on your page.
The main downside is it doesn’t give you any options for configuring your tests or setting up automatic monitoring.
For example, when you run a test, it will automatically test from the physical location where you’re running the test from. If you’re in a different location from your website’s target audience, this means you need to use a VPN to get actionable data… which is pretty annoying!
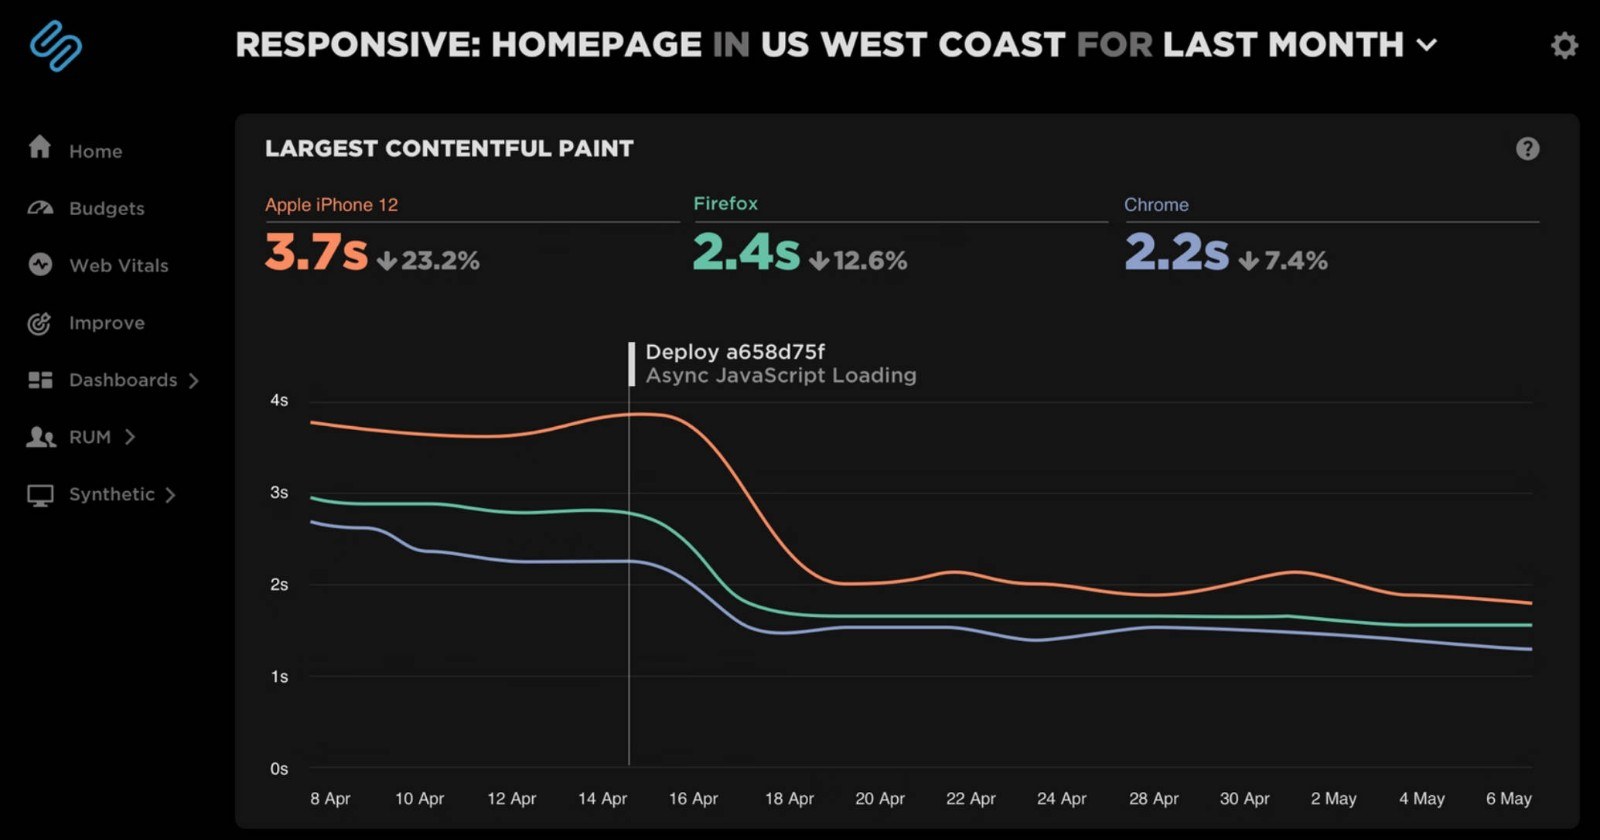
SpeedCurve
- 👍 Highly configurable.
- 👍 Offers way more data — more than any other tool on this list.
- 👍 Create your own custom dashboards.
- 👎 A lot more expensive… like, a lot.
SpeedCurve is a heavy-duty performance testing tool for large organizations that have the budget to spend $100+ per month on performance monitoring.
It supports both real user monitoring and synthetic testing. It also lets you create your own custom dashboards for pretty much any metric imaginable, which is great for being able to quickly access your site’s performance.
You can also benchmark your site against competitors, which is great for helping you to know where you stand. For example, you can create your own custom dashboard to see how key metrics for your site compare with your competitors’.
Overall, there’s a lot to love about this tool. The only downside is its price. It’s only worth the money if your business places a high premium on performance monitoring.
Get Started with Pingdom Today
Overall, where Pingdom really sets itself apart from the competition is in its paid tools.
The free Pingdom speed test tool is useful, but there are more flexible options when it comes to free performance testing (GTmetrix and WebPageTest are two of the best — here’s how to use GTmetrix). That certainly doesn’t mean you shouldn’t use the free version of Pingdom for performance analysis — you just shouldn’t rely on it alone.
However, with the paid service, you get access to a ton of useful performance and uptime analysis tools in a beautiful package.
Pingdom has built a service that’s equally useful to both people trying to grow their personal sites and much larger web-based companies. The dashboard is a joy to navigate, the mobile application is incredibly useful, and the on-site help is extremely easy to understand and follow.
Two of the most notable features are:
- Transaction Monitoring to quickly detect issues with important parts of your site.
- Real User Monitoring to see how quickly your site loads for all of your human visitors from around the world.
Even if you’re not in a position to pay for performance monitoring at this time, you can still take advantage of the 30-day free trial to collect 30 days of real user monitoring data for your site. This, combined with the other premium features, will give you some deep insight into your site’s real-world performance without costing anything.
If you’re not happy with how your site performs after collecting that data, I recommend doing two things:
- Follow our guide on how to speed up WordPress.
- Read our post on choosing high-quality WordPress hosting.
Related Reading:
Any experience with Pingdom? Any other useful tips or tricks?


All comments are held for moderation. We'll only publish comments that are on topic and adhere to our Commenting Policy.