
How to use the GTMetrix Speed Test Tool – Effectively – Everything You Need To Know!
- By
- Last updated:
- 1 Comment
Searching for a GTmetrix tutorial to help you to get the most from this free speed test tool?
GTmetrix is one of the most popular ways to test WordPress performance (or the performance of any other type of website). However, it throws a lot of data and suggestions at you, so it can be tough to know how to use it most effectively.
In this post, I’m going to break down exactly how GTmetrix works, so you can get the most value from it and understand how your website is performing (and how you can make it load even faster).
💡 Note: Considering upgrading to WordPress-optimized high-performance hosting? Take a look at this other post of ours comparing The Best Managed WordPress Hosting Services.
To achieve this, I’m going to cover the following information:
- Some important considerations for getting valuable data from GTmetrix.
- How to run a basic GTmetrix speed test and understand the information in the summary box.
- An explanation for all of the more advanced performance analysis features below the summary box.
- How to set up automatic performance monitoring using the website or the official GTmetrix WordPress plugin.
- Reasons to consider the paid version of GTmetrix (this post is focused on the free version, though — don’t worry).
- Some general WordPress performance tips.
- The best GTmetrix alternatives, in case you’re looking for other ways to test your site’s performance.
Table of Contents
Let’s dig in!
Four Important Speed Test Considerations for GTmetrix (and Other Tools)
Many tools, including GTmetrix, are great, but pretty useless if all you do is a one-off speed check. Instead, you’ll need to run multiple tests and experiment with other factors to get accurate results and understand how your site is actually performing for human visitors.
So, before we get into GTmetrix itself, let’s talk about some general theory for how to effectively run website speed tests using this tool (or others).
1. Number of Tests
To get a really good comprehensive set of data, you need to do a whole lot of speed tests, preferably at different times throughout the day. The ideal would be to schedule an hourly test and leave it running for about a week or so.
The reason for this is your website’s performance will change throughout the day, depending on your visitor count or even the usage of your server box if you’re on a shared host.
A nice side effect of this test is you’ll see your peak hours, which could potentially indicate the best time for you to post new content, or target ads or popups to your visitors.
That said, there’s still plenty to be learned by doing just five or ten tests over the course of an hour or so. Although the actual load speed given in seconds may change over the course of a day (or even week), some of the things GTmetrix can reveal — such as many of the recommendations it will yield on how to speed up your website — won’t change with time at all.
2. Test Locations
The proximity of your site to the test location (or a real human visitor) plays a big role in your test results because of physics (we still haven’t figured out how to change the speed of light!).
Because of that, the location you test your site from makes a big difference.
In general, you want to pick a test location that’s as close as possible to your target visitors (which should also be close to the physical location of your hosting server).
If your website only targets one location, all you really need to care about is the test results for that location.
However, if you’re targeting a global audience, you should pick four or five testing servers in key locations around the world. Try to spread them out if possible — e.g. choose at least one server from the US, one from Europe, one from Australia and one from Asia.
To be able to choose the location from which to test your site using GTmetrix, you’ll need to register for a free account.
If you’re targeting a global audience and you notice below-average page load times for certain regions, that may be a sign you need to start using a content delivery network (CDN).
3. Test Targets
I often see people testing ONLY their homepage. This is a big mistake that can skew things a lot more than you may think. First of all, your homepage may be the least data-intensive page on your site, making it naturally the fastest.
Also, your homepage may not be as important as you’d like to think. I worked on a site that acquired 97% of its traffic organically through search engines — almost all of which went to single posts/pages. So, be sure to focus on more than just your homepage!
In short: The speed of your homepage is important, but it may be secondary to many of your other pages, so be sure to also test a number of others, such as single post pages, store pages and product pages to get a well-rounded set of results.
4. Test Devices/Connection Speeds
When most people test the speed of their site, they only test the desktop experience and ignore the mobile experience.
This is a big mistake, as mobile traffic accounts for more than half of all traffic.
What’s more, your site speed can be significantly different on mobile devices than desktop devices. For example, most mobile devices, especially low-powered ones, will take longer to process JavaScript than desktop computers. So, if you have a JavaScript-heavy site, your mobile load times could be a lot slower than your desktop load times.
Connection speed is another important consideration. Not all of your visitors will be using ultra-fast wired connections. For example, they could be browsing from their phone on 4G, which will also lead to slower page load times.
If you want to get an accurate picture of how these visitors experience your site, it’s useful to experiment with different devices and connection speeds.
GTmetrix will let you test different connection speeds for free, but you’ll need to pay for a premium account if you want to test using a mobile device.
How to Use and Understand the Basic GTmetrix Speed Test
You can use the basic version of GTmetrix for free, which is the best way to get started with the tool.
While you can go to the main page and start analyzing your site right away, I’d recommend first registering for a free account because it’ll give you a lot more flexibility for configuring your tests.
When you use the basic speed test as an anonymous guest, you’re forced to use the following configuration:
- Test from Vancouver, Canada.
- Use a desktop Chrome browser.
- Use an ultra-fast unthrottled connection.
So, not only is it limited to Canada, but you’re also unable to adjust the device or connection speed. As we discussed above, that will make it difficult to get meaningful test results.
When you register for a free GTmetrix account, you open up a ton of new configuration options that’ll help you to address the considerations we discussed above.
- Locations — San Antonio, Texas (USA), Hong Kong (China), London (UK), Mumbai (India), Sydney (Australia), Sao Paulo (Brazil), Vancouver (Canada). Paid accounts get even more options.
- Test devices — unfortunately, you can still only test from a desktop device with the free version. While GTmetrix used to offer free mobile testing, the service has now locked all of the mobile test devices behind the paid version.
- Connection speeds — various options from Broadband down to 56k (dial-up — remember those days?).
The free account also gives you access to more analysis tools (more on those later).
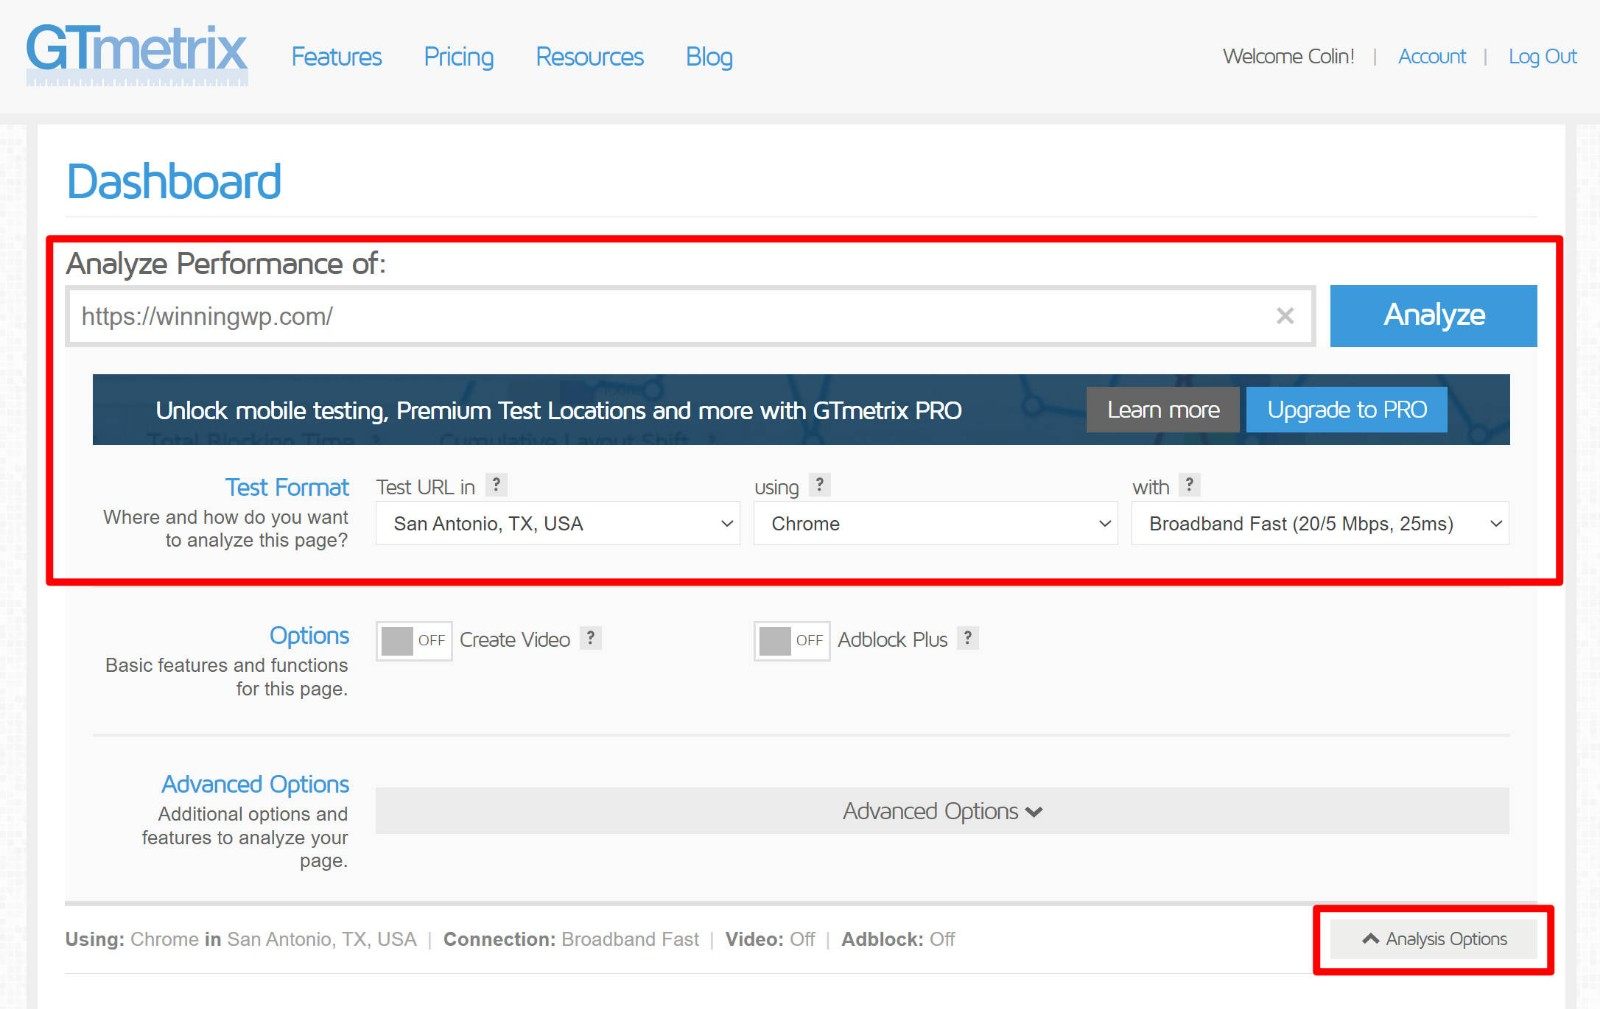
Once you’ve created your free account, you can:
- Enter your site’s URL in the box.
- Click the Analysis Options accordion button to expand the extra options.
To get an accurate picture of your site’s load times, you should make at least two choices:
- Select the location nearest to your target audience using the Test URL in drop-down.
- Select Broadband (Fast) in the connection drop-down. This will use a connection speed that’s around the average for the USA as a whole — you can choose a different connection speed if that fits your needs.
Once you run your test, GTmetrix will show you a summary box that looks like this:
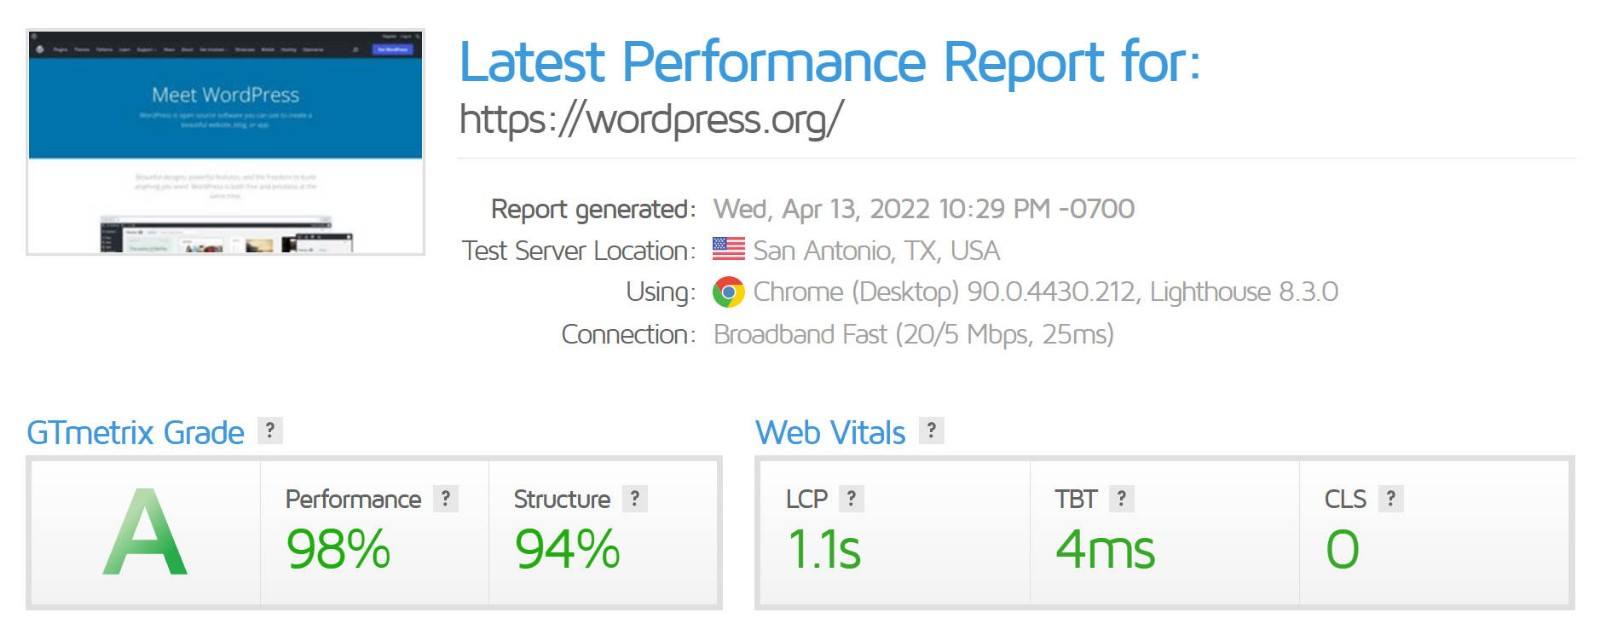
The summary box contains six pieces of information, divided into two boxes.
GTmetrix Grade
These don’t analyze your performance directly. Rather, they try to help you understand how well you’ve optimized your site for performance.
- Letter grade — an overall score for your site’s optimization.
- Performance — this is essentially your Lighthouse performance score, which is the same analysis used by Google’s PageSpeed Insights tool.
- Structure — this is a proprietary score that combines Lighthouse with some of GTmetrix’s own audits. It’s supposed to represent how optimized your page is.
Web Vitals
These show the actual performance data, with a focus on Google’s new Core Web Vitals initiative.
- LCP — this is the page’s Largest Contentful Paint time, which measures how long it takes the page’s ‘main’ content to load. Google recommends that your LCP time is under 2.5 seconds.
- TBT — this is the Total Blocking Time, which is a proxy for the First Input Delay (FID) metric in Core Web Vitals (FID is only available in real user data, so GTmetrix can’t directly test it). Ideally, your TBT should be under 150 ms.
- CLS — this is the Cumulative Layout Shift metric from Core Web Vitals. It measures how much your content ‘moves’ or ‘shifts’ as it loads. Your CLS score should be under 0.1
Don’t stress too much about the GTmetrix Grade scores. These scores can be a useful guide for how optimized your site is, but the only numbers that really matter are your Core Web Vitals and other load time metrics.
Why Is There No ‘Load Time’ Metric?
In the past, GTmetrix used the fully loaded time metric, which measured how long it took the page to completely load.
However, GTmetrix shifted to these new metrics shortly after Google started its push to use the Core Web Vitals metrics (Largest Contentful Paint, First Input Delay and Cumulative Layout Shift).
At least personally, I think this is a good decision, because people tend to overly focus on fully loaded time, when that’s not necessarily what most human visitors care about.
What most human visitors actually care about is how long it takes them to start interacting with your site and engaging with your content. The Largest Contentful Paint metric tries to do a better job of measuring when this point is by looking at how long it takes for your main content to load, rather than how long it takes for every single script to load.
With that being said, you can still access all of the other performance metrics in the more detailed analysis GTmetrix provides, which I’ll show you in the next section.
How to Use the Advanced Analysis Options in GTmetrix
The snapshot above gives you a good example of your site’s current metrics and how well it performs in Core Web Vitals. But, if you want more details, GTmetrix provides a lot more information below the summary box.
GTmetrix divides these additional options into six tabs:
- Summary — provides a high-level summary of some additional performance metrics, as well as the top issues with your site’s performance.
- Performance — provides a lot more performance data and timings, including fully loaded time, time to first byte (TTFB) and lots more.
- Structure — shows the detailed analysis of why your site scored the way it did in GTmetrix’s Structure grade. It also provides lots of tips to improve your score (and thus your site’s performance).
- Waterfall — helps you to see how each individual HTTP request loads on your site. It’s more advanced, but it gives you a lot of information for optimizing your site’s performance.
- Video — lets you film a video of how your site visibly loads (requires a free account to access). This can be especially useful for detecting issues with layout shifts and improving your Cumulative Layout Shift score.
- History — lets you track your site’s performance over time (this also requires a free account).
Let’s go through all of the tabs and how best to use them.
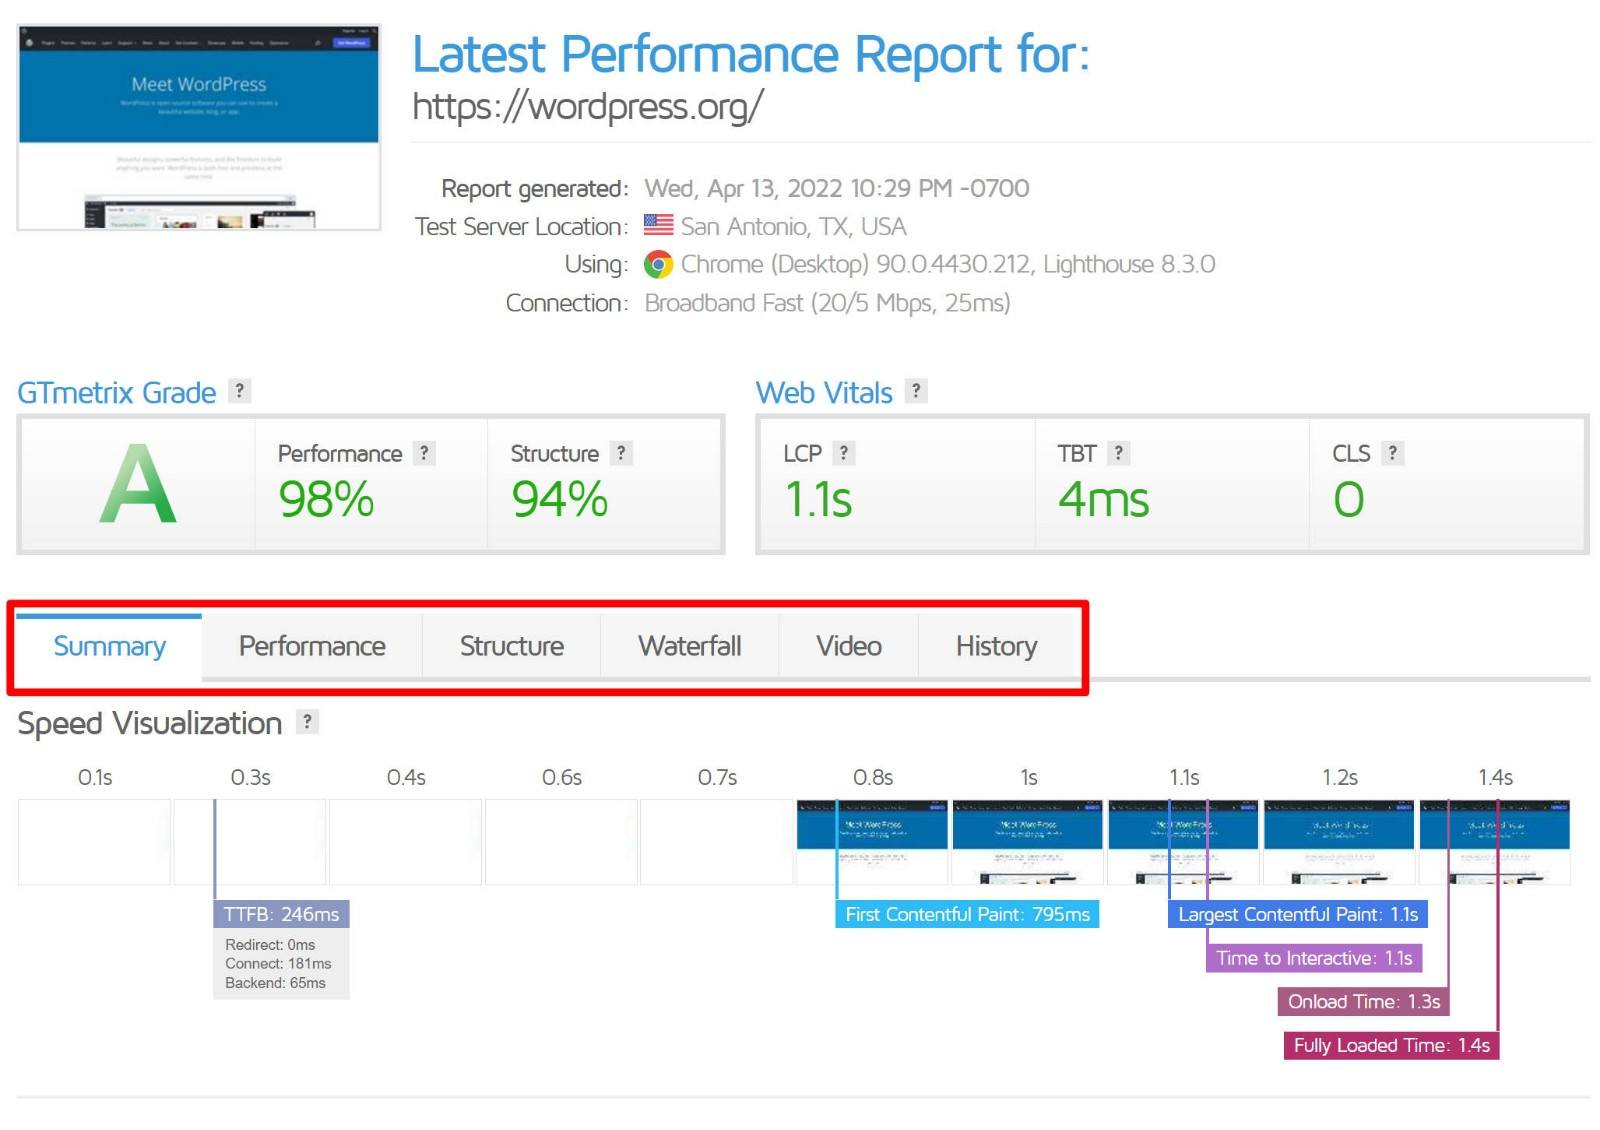
Summary
The Summary tab isn’t focused on a single area. Rather, it provides a summary of the most important information from some of the other analysis areas. Makes sense given the name, right?
The Speed Visualization (pictured above) lets you see what your site visually looks like as it passes different performance metrics. For example, you can see exactly what your site looks like at the moment of the Largest Contentful Paint metric.
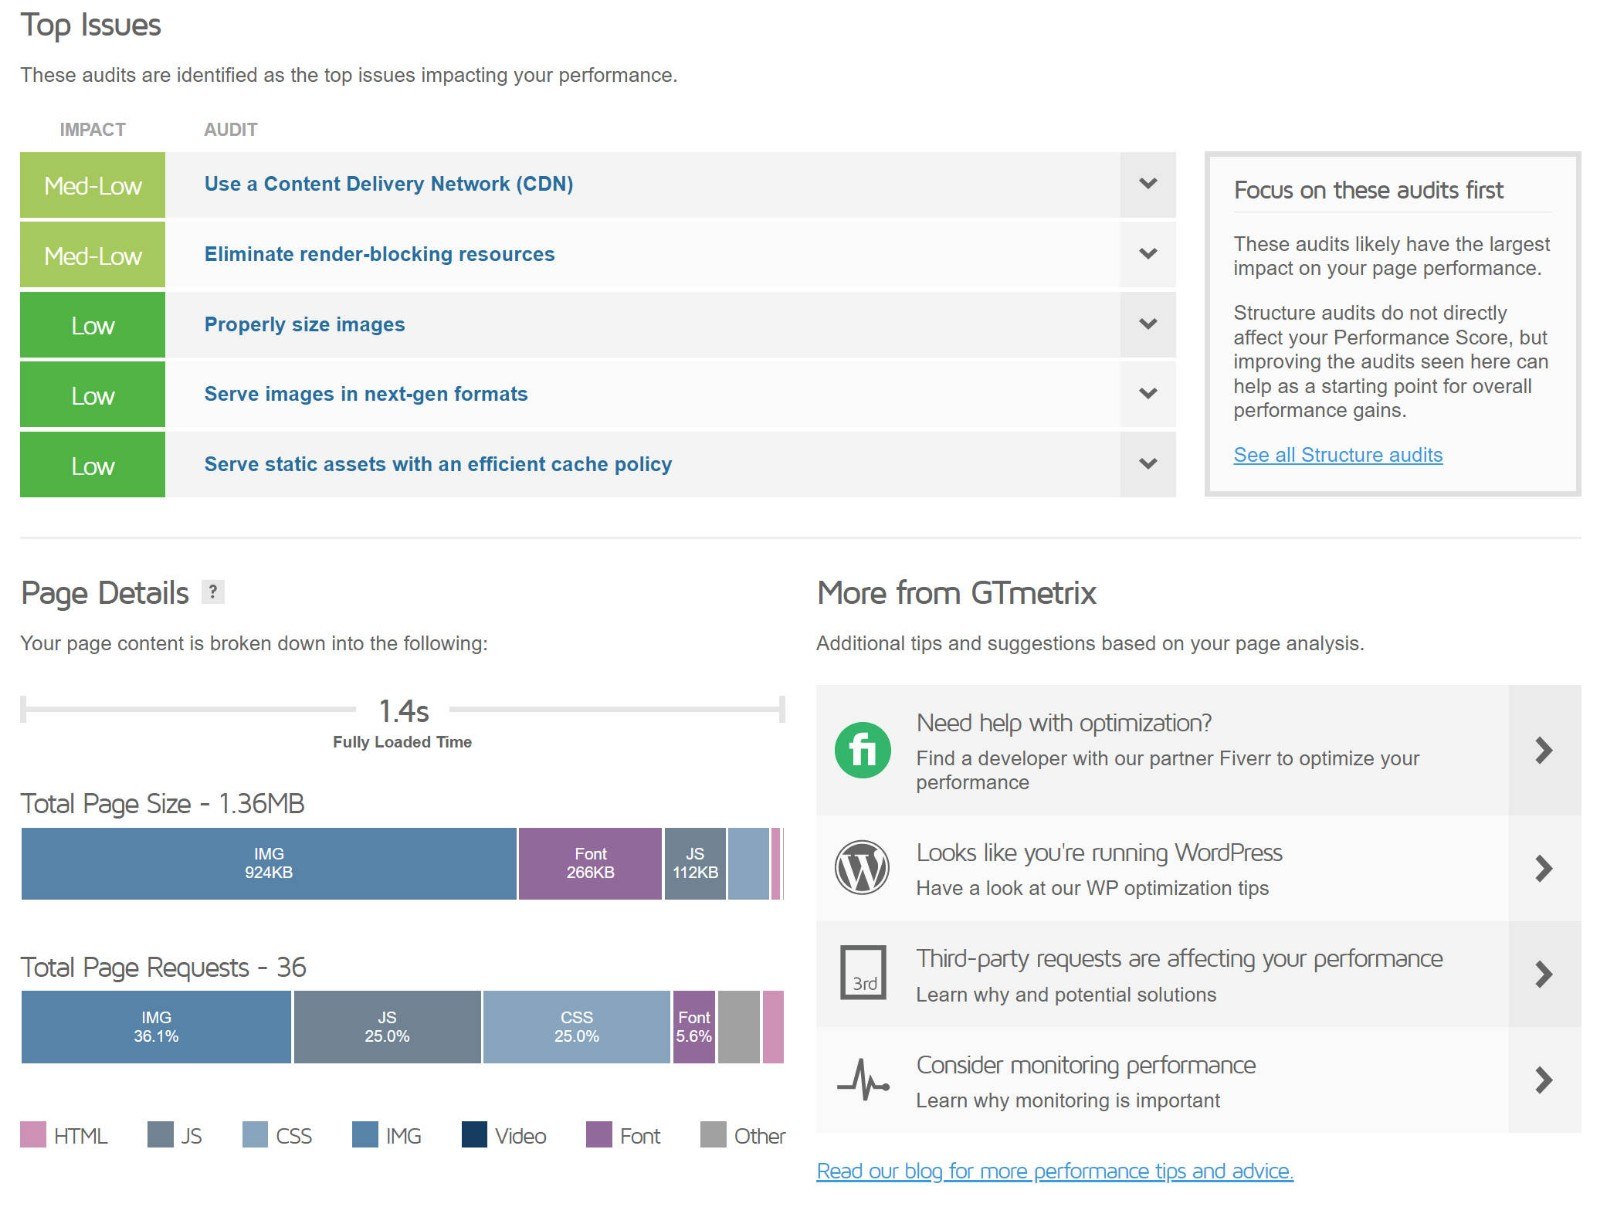
The Top Issues tab lists a few of the biggest optimization opportunities for your site. However, you can find all of this information in the Structure tab, so you can just wait to engage with these details for now.
Finally, the Page Details tab lets you see the page size and HTTP requests for the page. You can also see where these come from — e.g. images, JavaScript, CSS, fonts, and so on.
This is the only area where you’ll see these details, so it’s worth taking a peek. For example, if you notice a large percentage of your page’s size comes from images, that may mean you can make big performance gains by optimizing these.
Performance
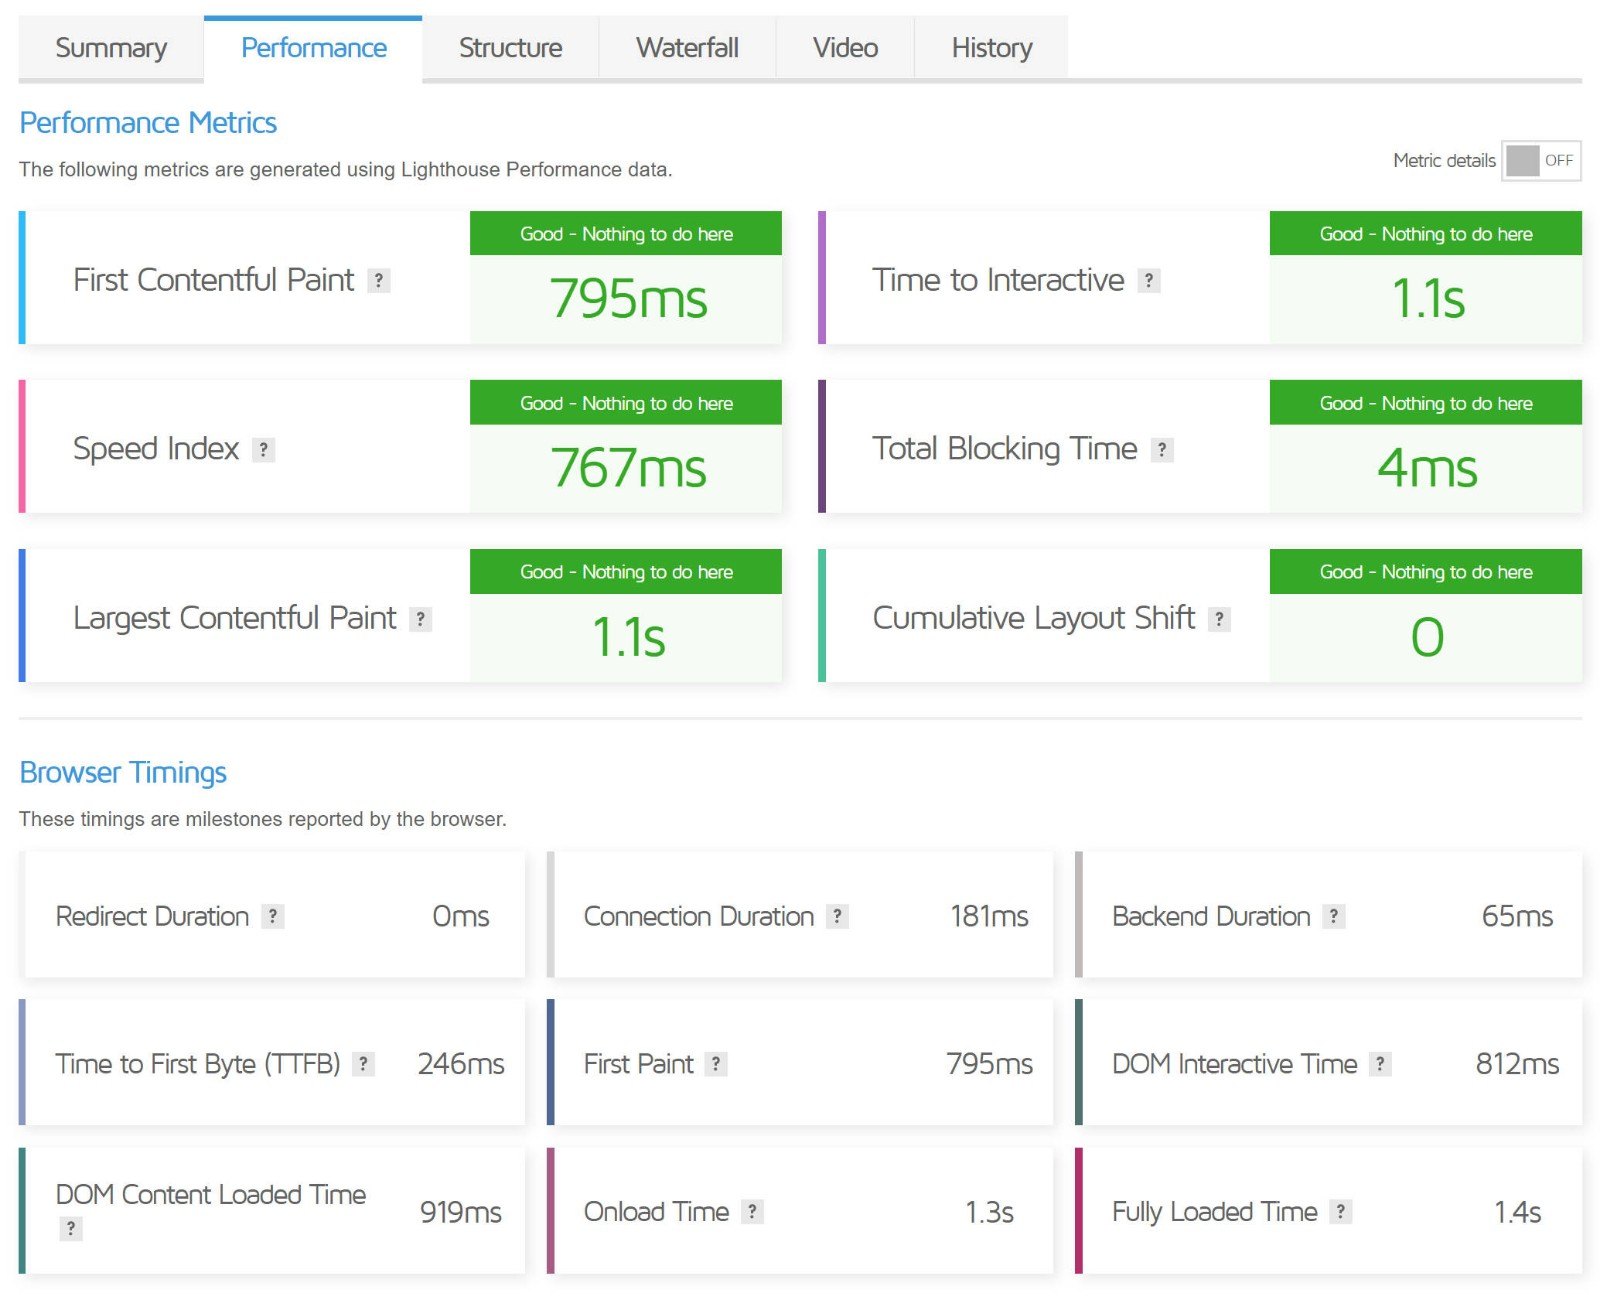
The Performance tab gives you a lot more performance metrics and timing details. If you’re disappointed that you’re only able to see the Largest Contentful Paint time in the summary box, this page more than makes up for it.
In the Performance Metrics section, you can see the following metrics:
- First Contentful Paint
- Speed Index
- Largest Contentful Paint
- Time to Interactive
- Total Blocking Time
- Cumulative Layout Shift
And then if you go to the Browser Timings section, you’ll get another nine metrics:
- Redirect Duration
- Connection Duration
- Backend Duration
- Time to First Byte (TTFB)
- First Paint
- DOM Interactive Time
- DOM Content Loaded Time
- Onload Time
- Fully Loaded Time
Rather than trying to explain what each piece of data means, I’m going to point out a really helpful interface feature in the GTmetrix interface. If you hover your mouse over the question mark next to any metric, you can see a full explanation from GTmetrix:
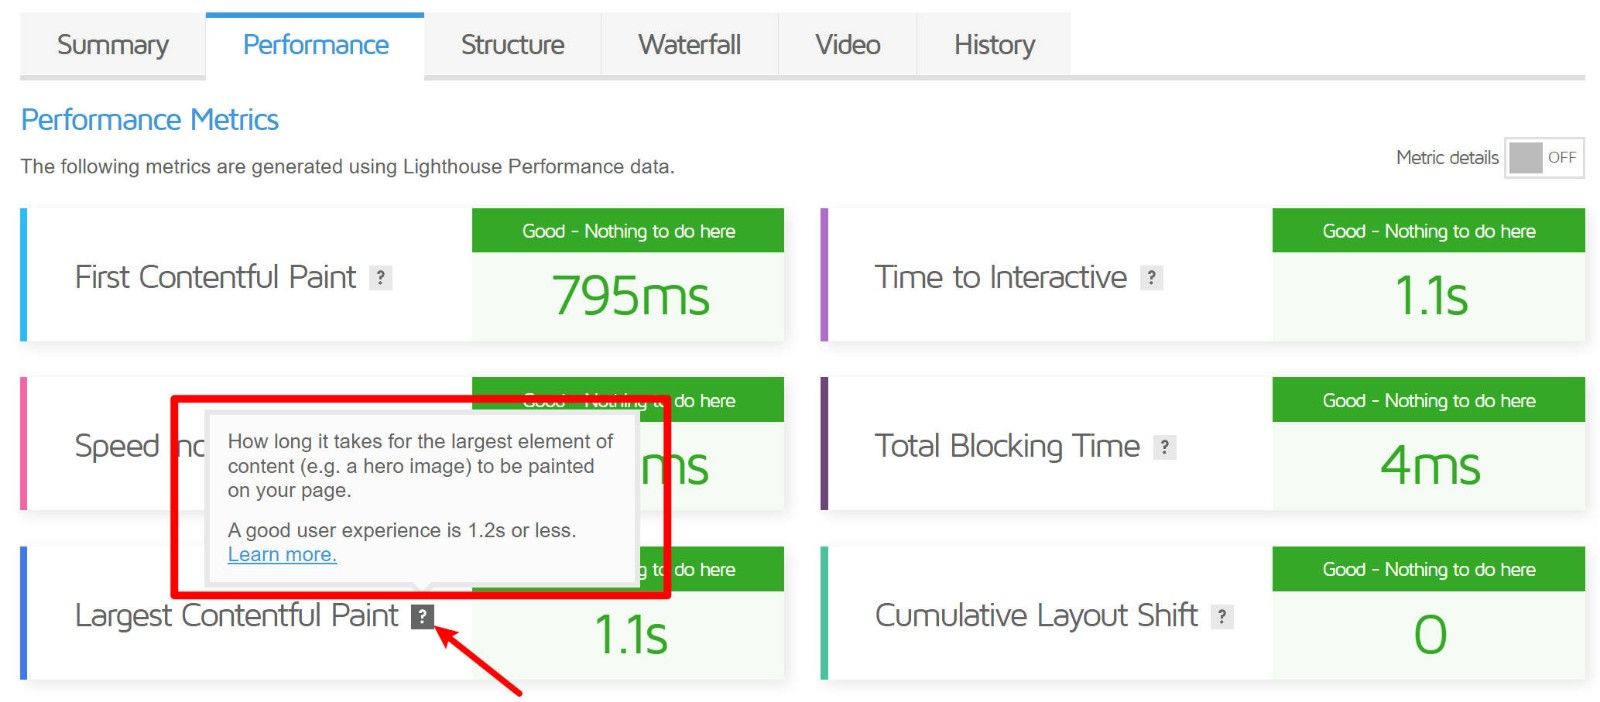
You’ll find these tooltip explanations in other areas of the interface as well.
In general, GTmetrix does a great job of explaining all of the different performance terminology, which is a big point in its favor.
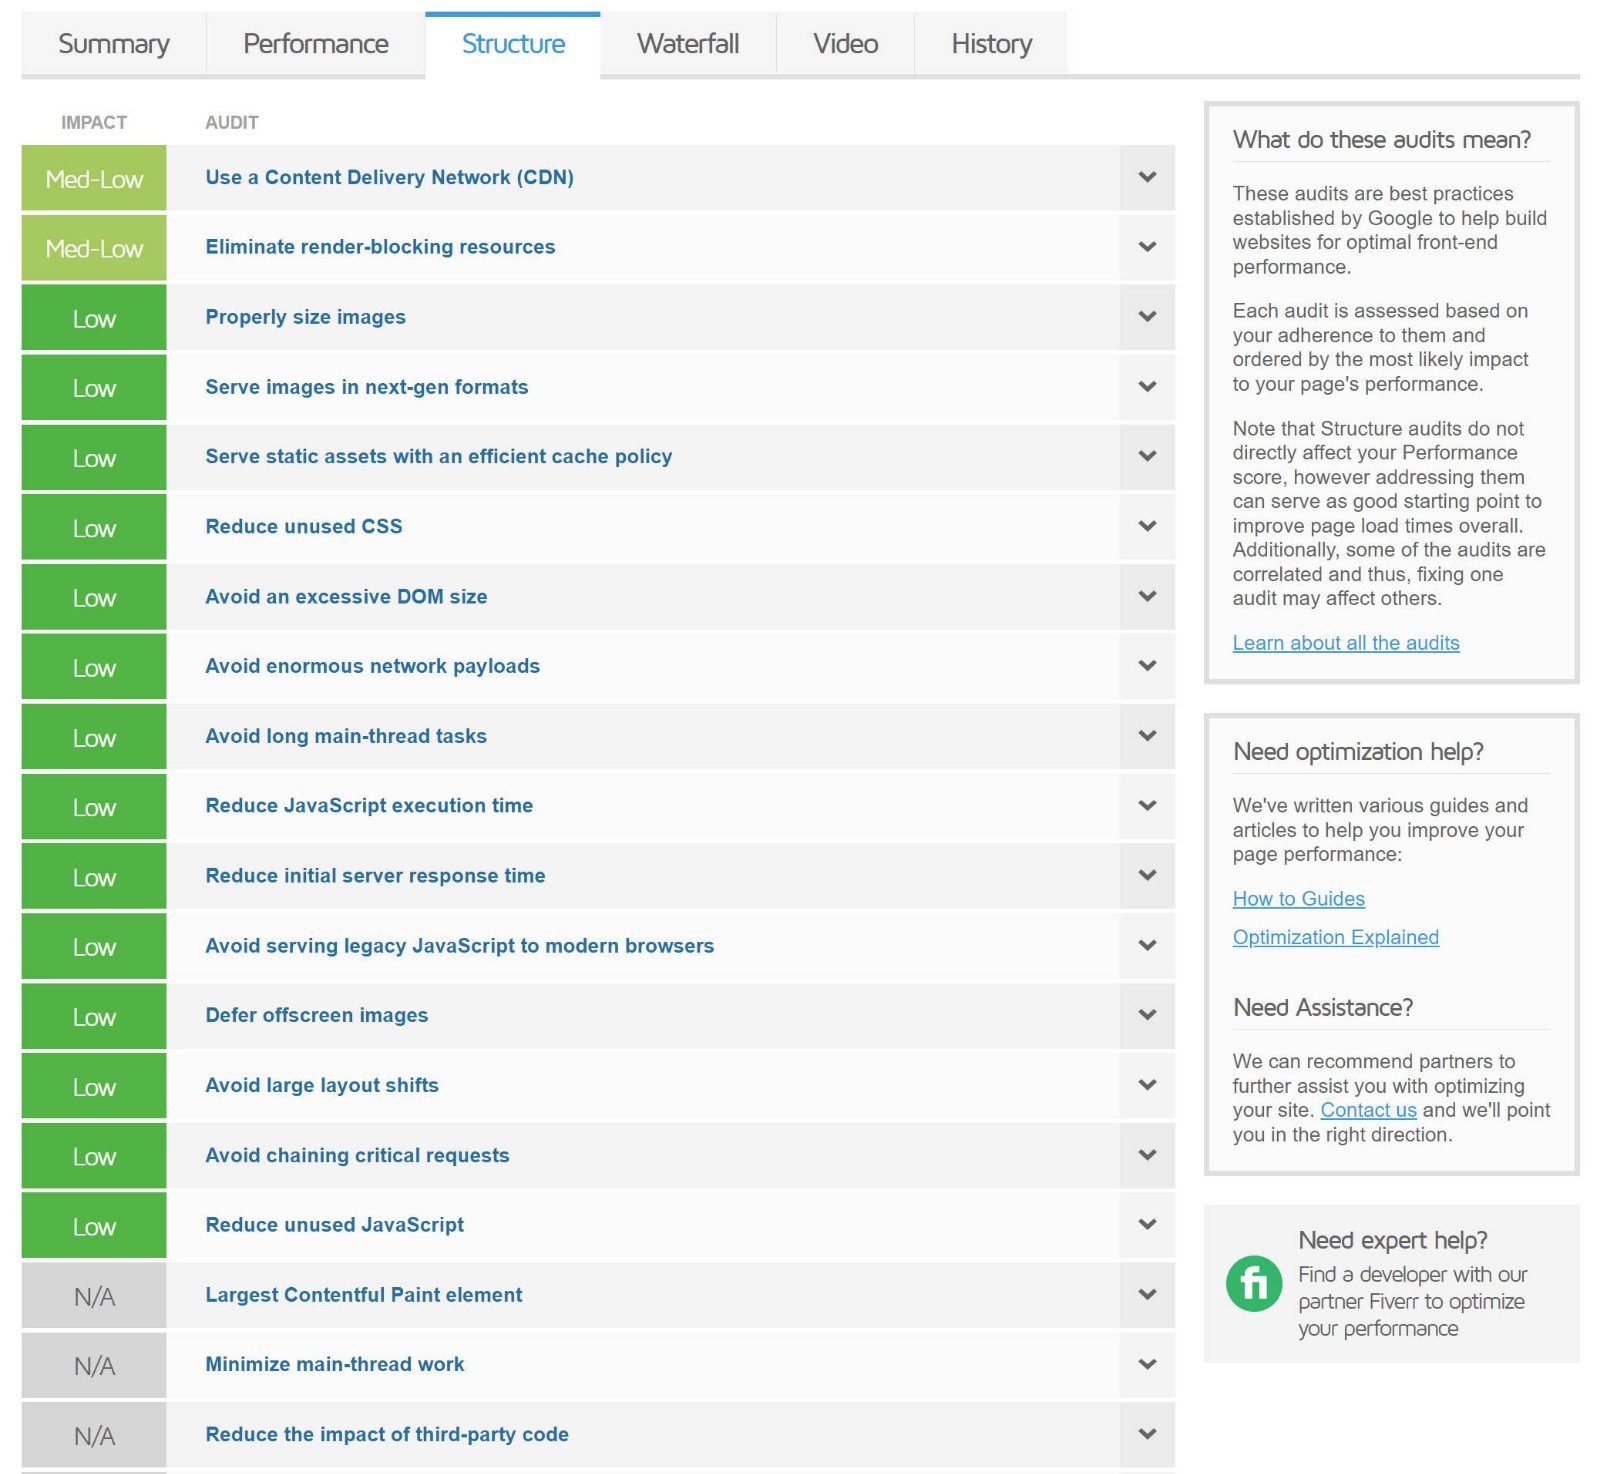
Structure
The Structure tab provides the results of all of the performance optimization checks GTmetrix has run. These are what factored into the Structure score you saw in the summary box.
GTmetrix will also list the potential impact of that tactic, so you know where to focus your energy:
If you click the accordion section next to any check, GTmetrix will share more information about what it means, along with the specific details of how your site did for that check.
For example, if you expand the Reduce Unused CSS check, GTmetrix will show you the specific CSS files that are causing issues on your site, along with the potential savings you’d achieve by optimizing them:
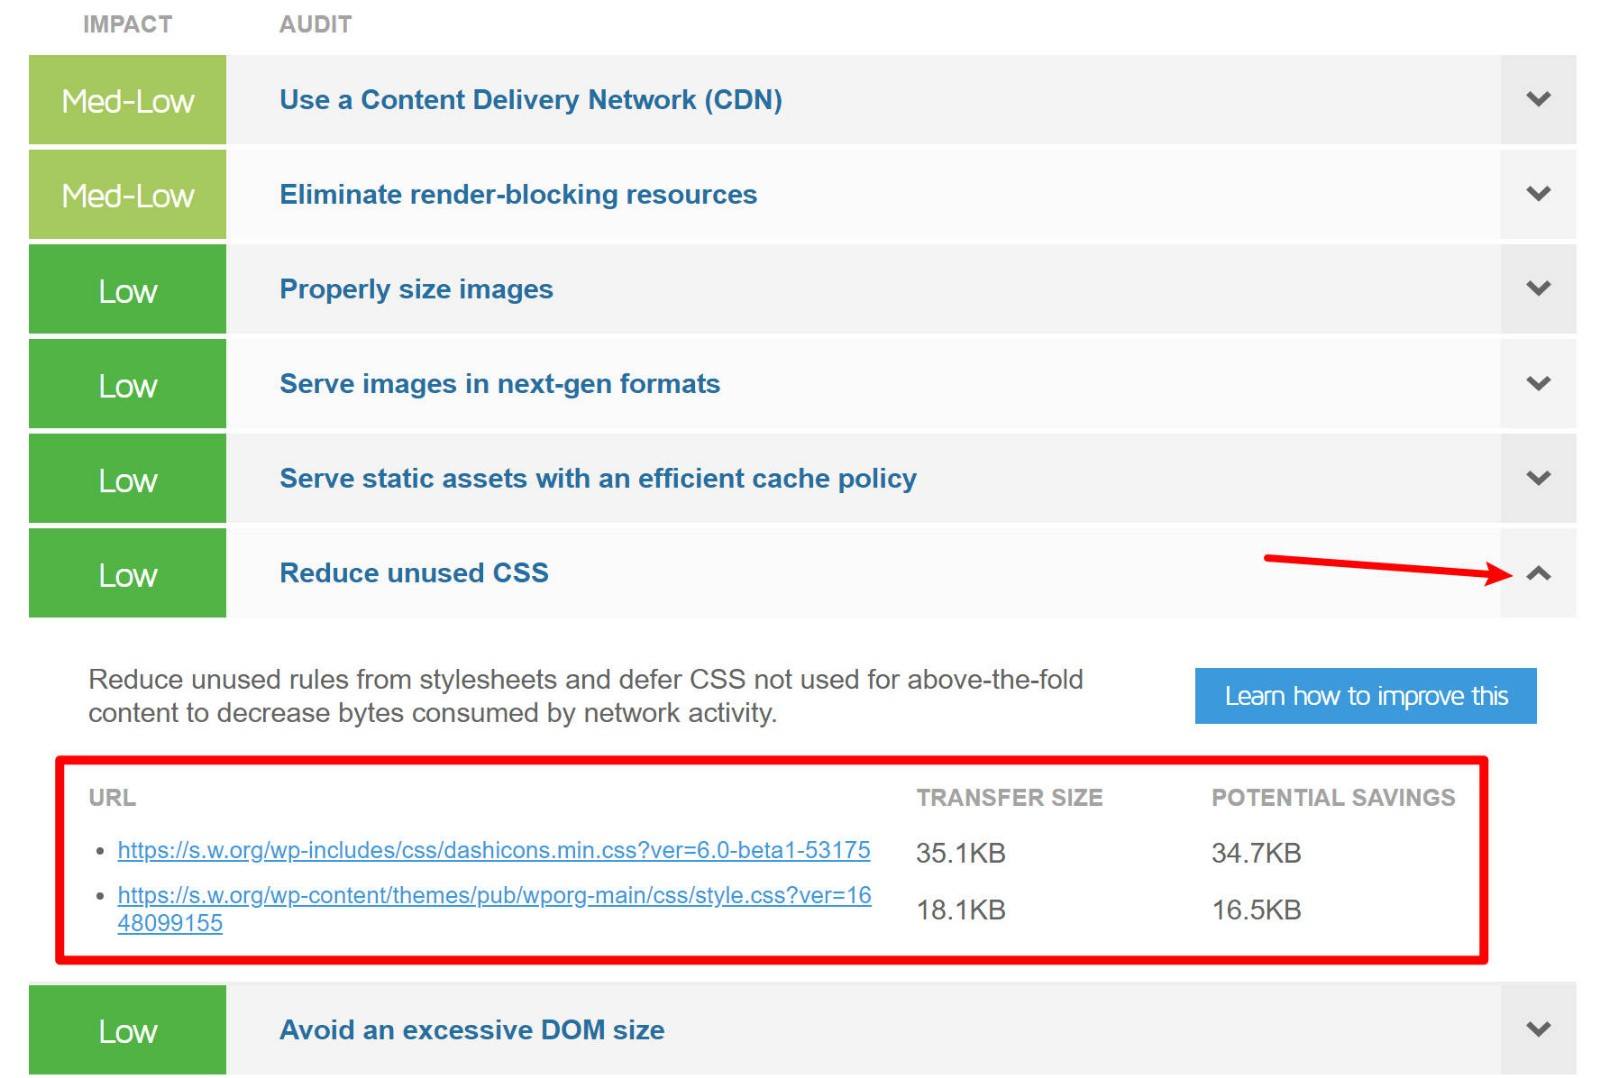
This is great because it lets you go straight to the resources that are causing problems.
With that being said, I caution you from feeling you must pass every single check. While it’s worth browsing these to see areas where you may be able to improve your site’s performance, you do not need to have a perfect score to have a fast-loading site.
Your human visitors care about your site’s actual load times — they don’t care about some arbitrary score.
Basically:
- If your site’s loading slowly, definitely check out these suggestions, as they’ll show you ways to improve.
- If your site’s already loading really quickly, you don’t need to try to fix every single low-impact issue because you’ll soon hit the point of diminishing returns.
Waterfall
The GTmetrix waterfall is one of the most useful tools for pinpointing bottlenecks in your website’s speed. It gives you insight into each HTTP request on your site and where/how quickly it loads.
Without getting into too much detail, every asset on your site is a separate HTTP request. An asset could be an image file, a CSS stylesheet, a script, and so on.
If the test summary box says your site has 26 requests, that means it needs to load 26 assets. It also means you’ll have 26 different entries in the waterfall analysis.
Each asset on your site needs to be looked up, transferred and displayed. Each bar in the waterfall shows all of the steps involved for each asset and how long they’ve taken.
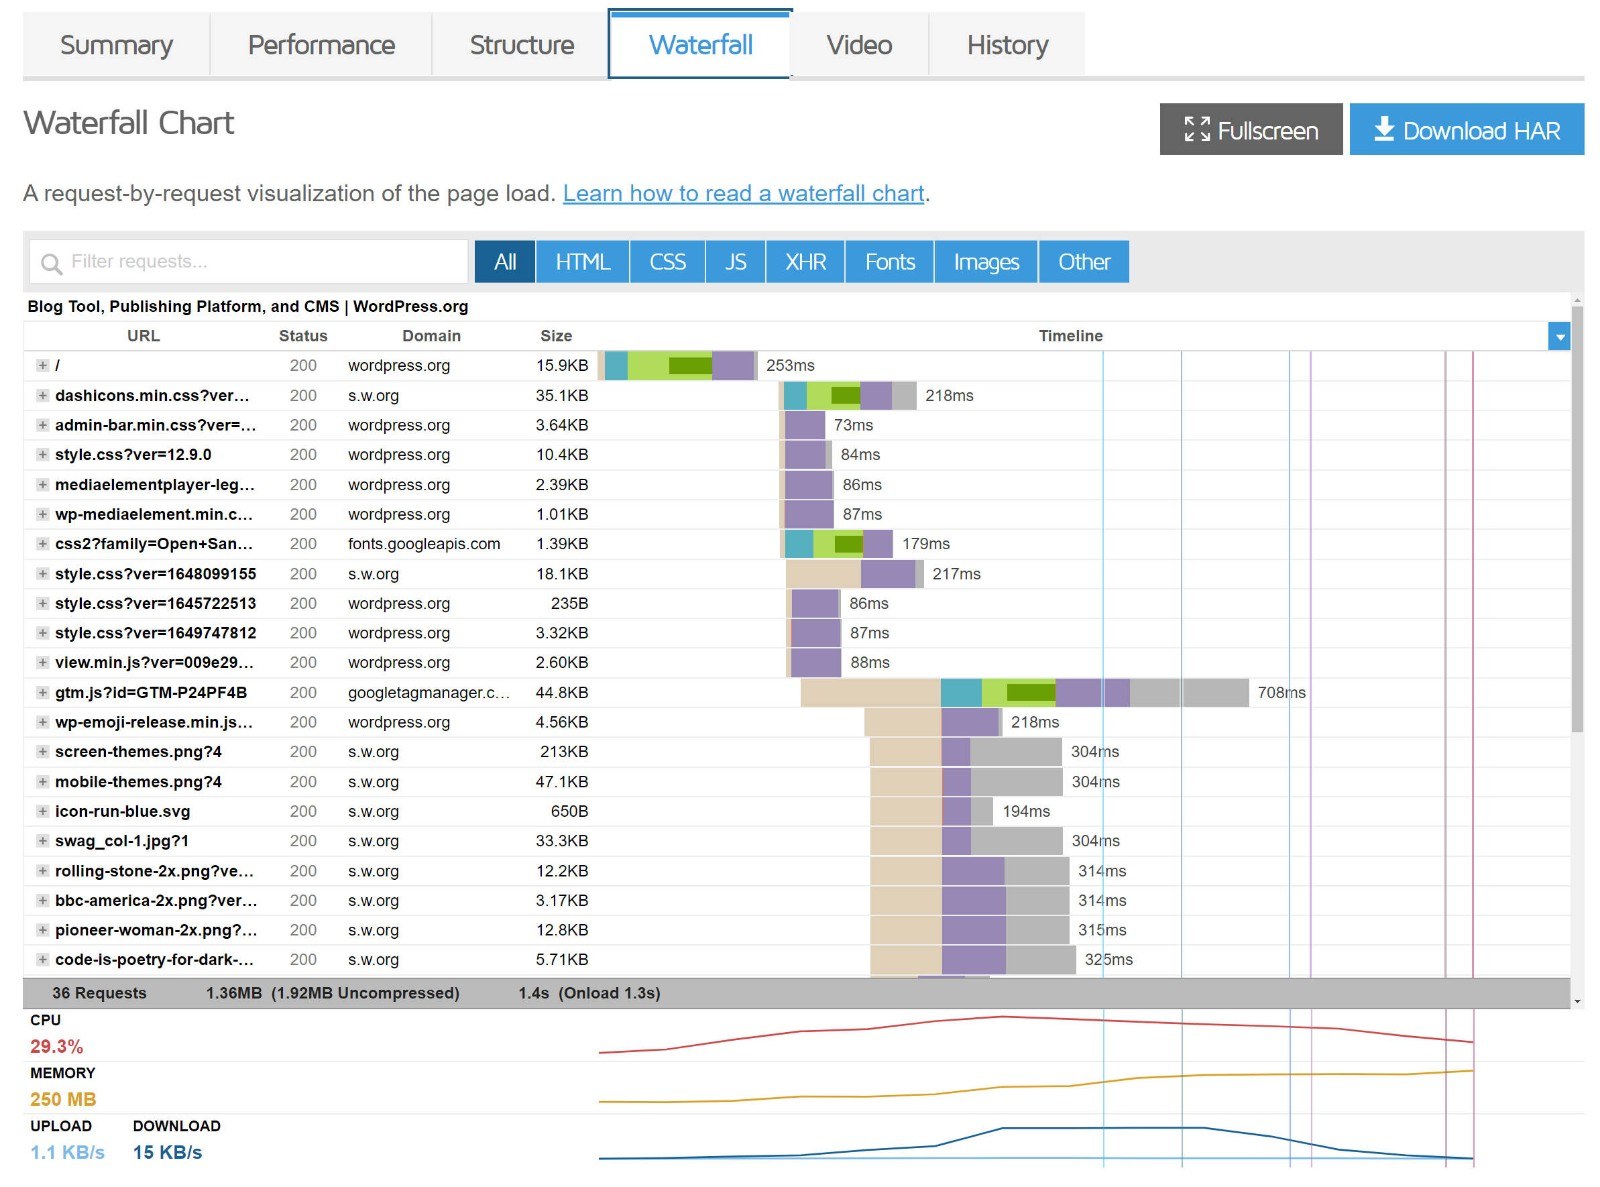
The steps each asset can go through are as follows, with a little explanation added:
- DNS Lookup: Time to resolve the DNS.
- Connecting: Time taken to create a connection.
- Blocking: Time spent in the browser queue waiting for a connection.
- Sending: Time taken to send the request.
- Waiting: Time spent waiting for the response (time to first byte).
- Receiving: Time taken to download content.
You can also see the event timing relative to metrics such as Largest Contentful Paint.
Based on this information, you can make some assumptions about what’s going on with your website.
First of all, take a look at that small vertical blue line in the waterfall above (on the right side). It represents the point at which the DOM was loaded. The red line represents the time the page was loaded.
The time to first byte (TTFB) is also considered an important indicator of your server speed, and is shown by the waiting information in the waterfall. If you’re consistently seeing a high TTFB (even after going through and fulfilling the main recommendations for improving site speed), it may be that your host server is what’s letting you down!
Another helpful way to use the GTmetrix waterfall analysis is to analyze the impact of various plugins on your site. For example, if you search for ‘brizy’, you can view all of the scripts the Brizy builder has added to your site.
If you see lots of slow-loading scripts from a plugin, it’s an indicator that it may be negatively affecting your performance. In that case, you may want to put extra effort into optimizing it (or consider switching to a different plugin).
The waterfall analysis is one of the most technical parts of GTmetrix, but it’s also one of the most useful. If you’re still not sure how to use it effectively, GTmetrix offers a detailed guide on how to read and analyze every part of the waterfall.
Video
The Video tab is another useful tool that helps you to gauge how your site loads to humans. It can help you to go beyond the top-line number and discover some of the following:
- When is content visible?
- Are there any flashes of unstyled content? For example, sometimes it takes some time for a custom font to load, so your text will ‘jump’ when it changes from a system font to the custom font.
- Are there any large content ‘shifts’? Sometimes, content will ‘jump’ or ‘shift’ as additional assets load. You’ve probably experienced this on content sites where the text ‘jumps down’ when the site loads an ad.
The last item is another part of Google’s Core Web Vitals — it’s called ‘Cumulative Layout Shift (CLS)‘.
The Videos tab lets you watch a screen recording of your site loading with two enhancements:
- You can slow down the recording to 1/4 speed, which helps you to more easily see any content shifts or flashes of unstyled content.
- You can jump to major timing milestones, such as Largest Contentful Paint.
For example, here’s what the exact moment of Largest Contentful Paint looks like at WordPress.org:
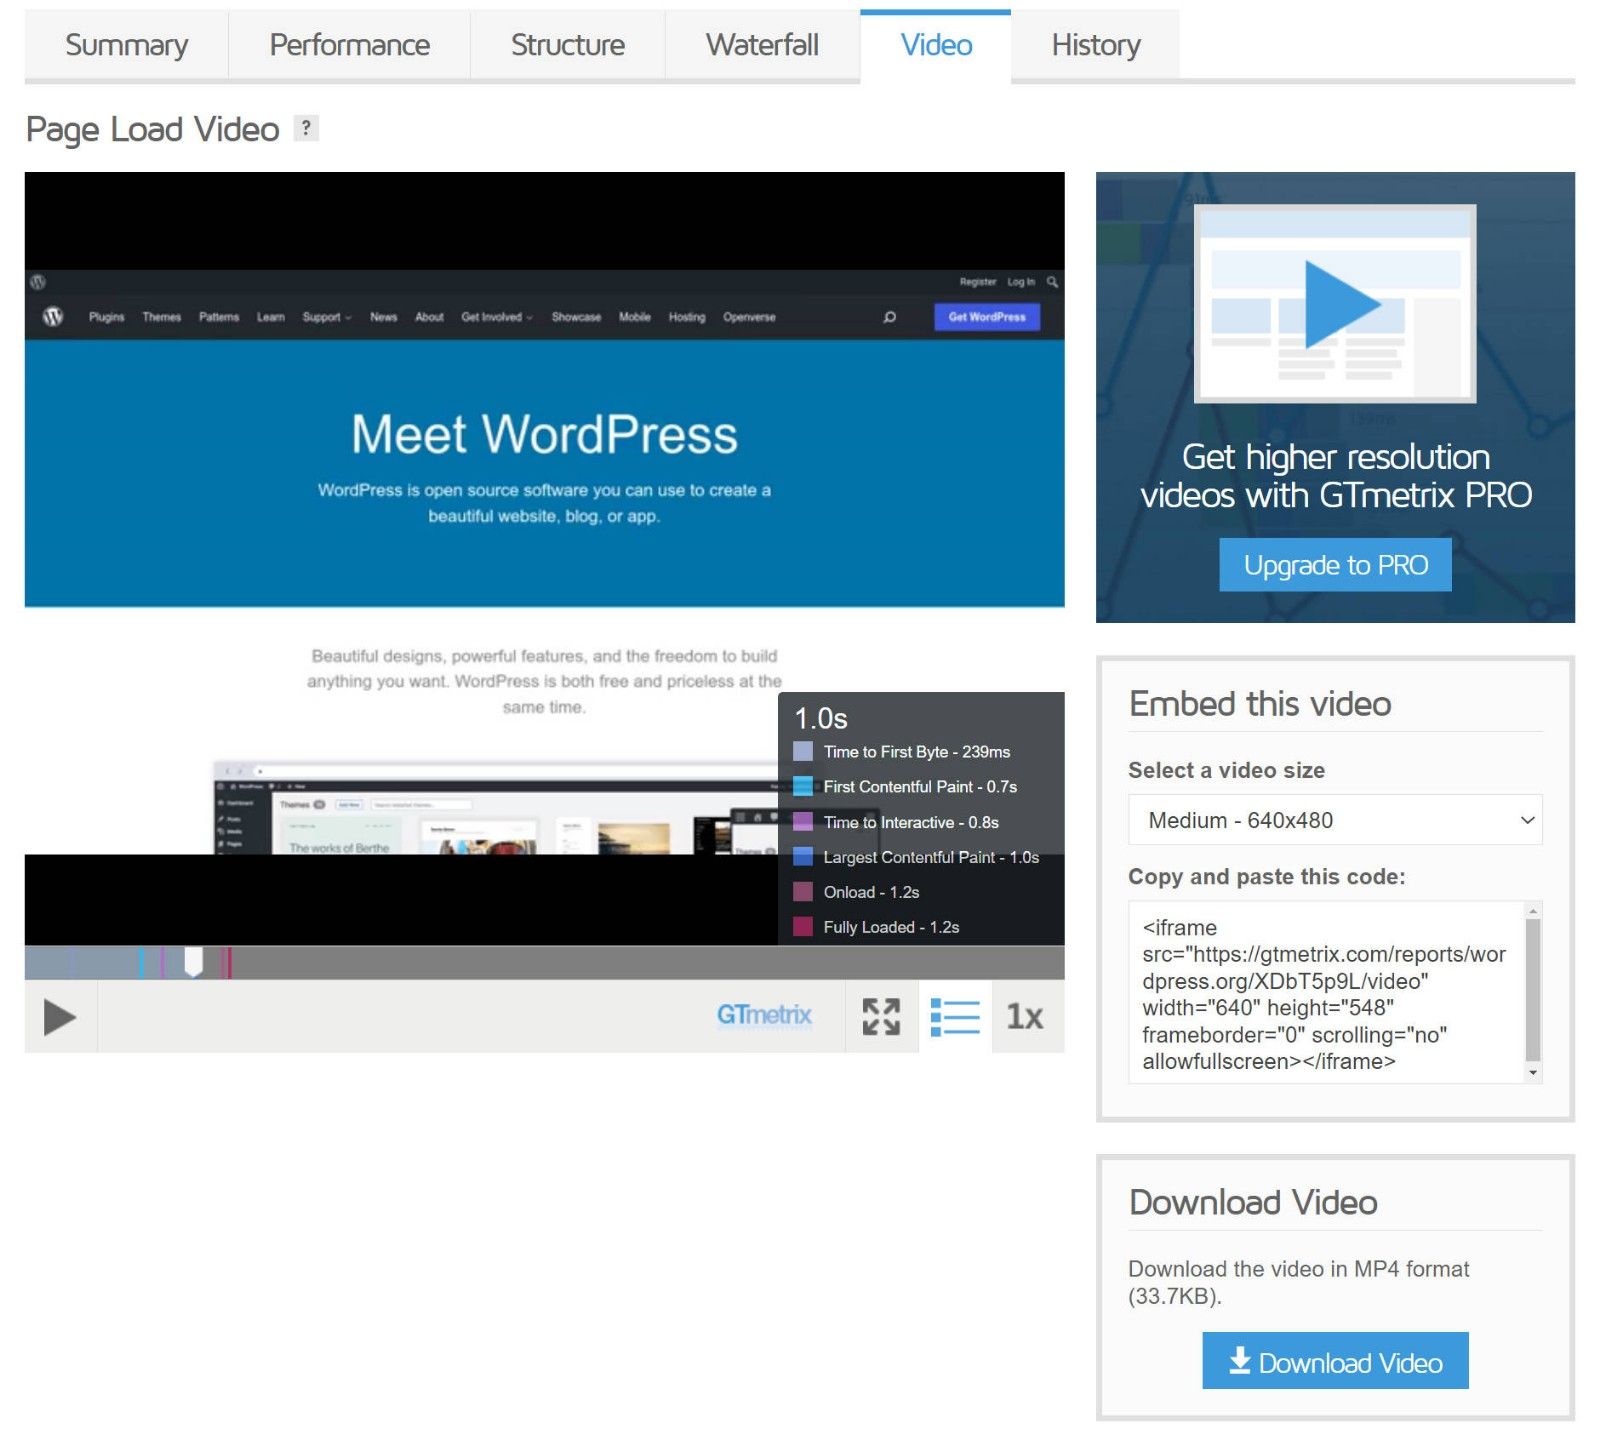
Interesting, right?
Because Google is putting more emphasis on these types of ‘user experience’ loading metrics, it’s a good idea to take advantage of this feature so you can catch issues.
To take a video recording, you’ll need to do two things:
- Register for a free GTmetrix account.
- Turn on the Create Video setting when you run a test.
History
The History tab allows you to view the results of multiple tests on one page in an easy-to-understand graph. It’s useful for seeing how your page load times change over time.
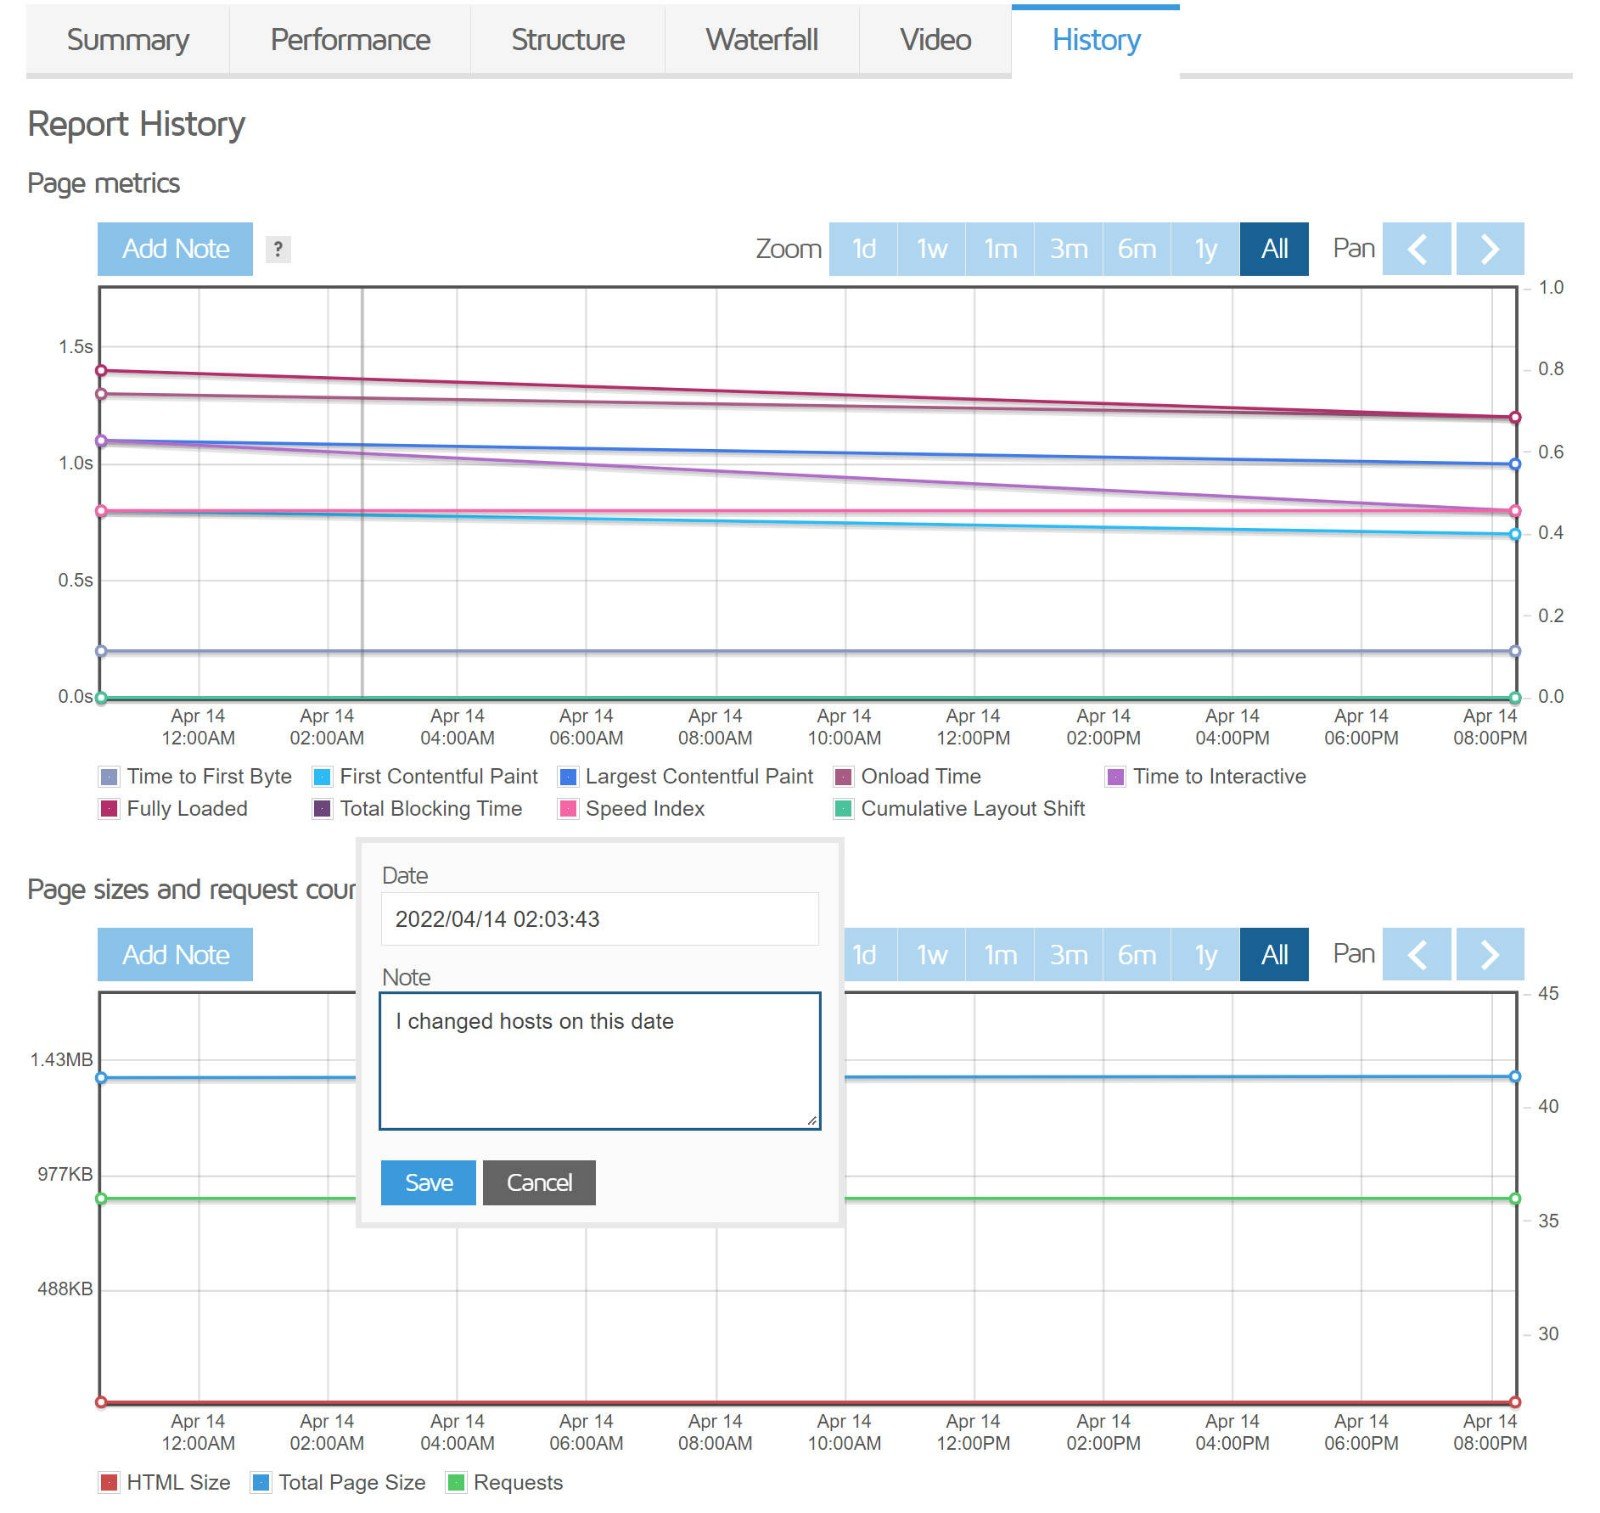
You can also add notes, which is another useful tool. For example, if you switched to a new host or caching plugin, you could add a note in GTmetrix to see how that change affected your load times.
The GTmetrix free plan lets you see up to three months of data, while the paid plans add longer retention.
How to Set Up Automatic Monitoring and Alerts With GTmetrix
Another useful feature you get with your GTmetrix account is the ability to set up automatic performance monitoring. You can use monitoring with a free account, but it’s heavily limited, and you can only set up automatic tests from the Vancouver, Canada server — you can’t choose the other test locations.
You can choose from the following frequencies for up to three URLs:
- Daily
- Weekly
- Monthly
To enable monitoring, click on the Monitor button at the top of the test results page (or the side, depending on your screen resolution) to open a slide-out to configure how to monitor your site:
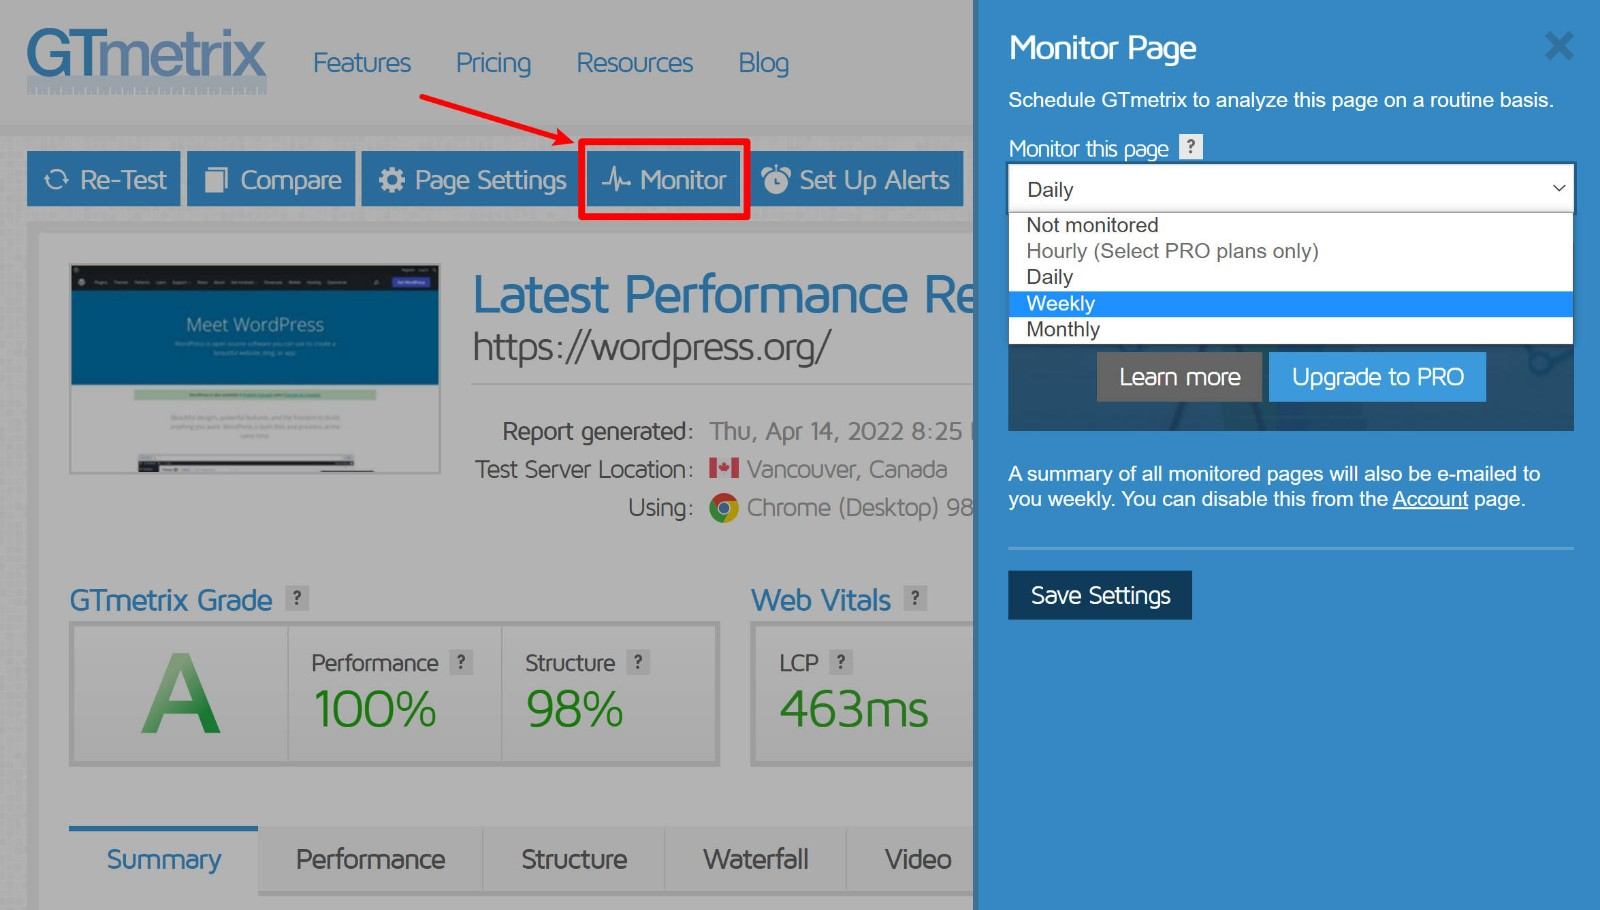
GTmetrix will send you an email digest of your results, and you’ll also be able to view them from the History tab.
If you pay for GTmetrix Pro, you’ll unlock the ability to monitor from different test locations, as well as hourly monitoring tests and the ability to monitor additional websites.
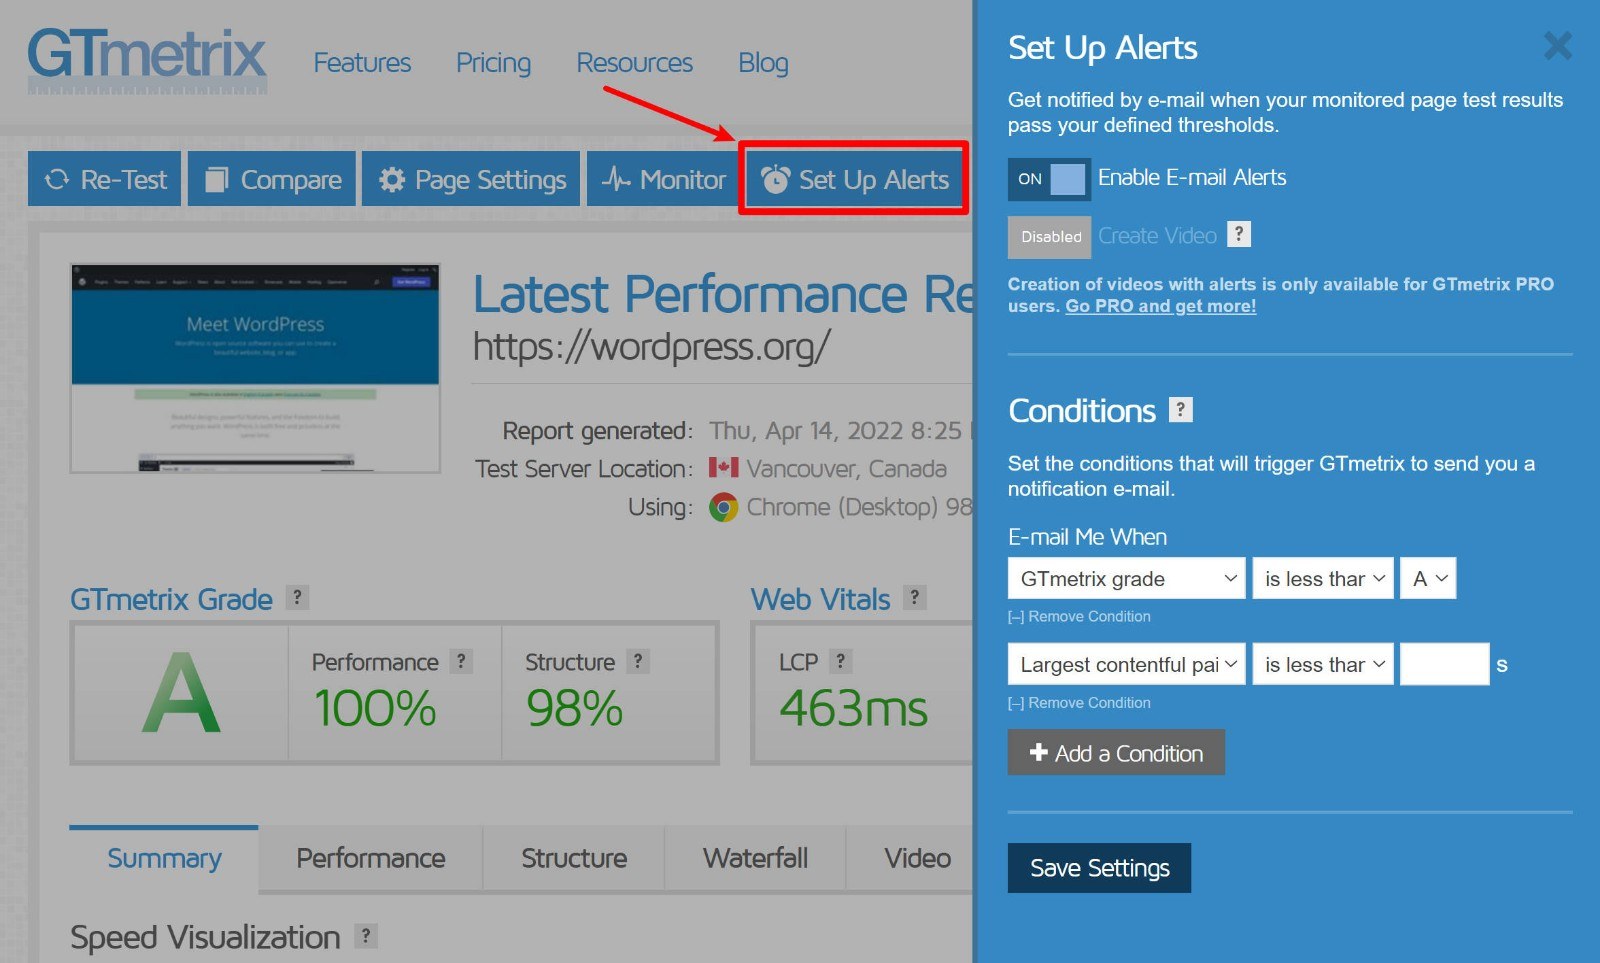
Once you enable monitoring, you’ll also be able to set up custom alerts — for example, you can receive an alert if your page load time goes above a certain number, if your TTFB increases, and lots of other conditions.
You can set these up by clicking the Set up Alerts button in the test results interface:
How to Use the GTmetrix WordPress Plugin for Automatic Monitoring
If you’re a WordPress user, there’s also an official GTmetrix WordPress plugin that can help you to monitor your WordPress site’s performance.
The plugin hadn’t been updated in two years at the time of updating our GTmetrix tutorial, but I tested it on my site and it did seem to still work fine. However, it showed metrics from the older GTmetrix report, rather than the new Core Web Vitals metrics. That is, it will show you your site’s fully loaded time instead of the Largest Contentful Paint time.
If you want to use the new GTmetrix report, you’ll need to stick with the web interface for now.
Here’s how it works…
1. Install and Configure Plugin
To use it, first install and activate the free GTmetrix WordPress plugin from the official WordPress.org directory.
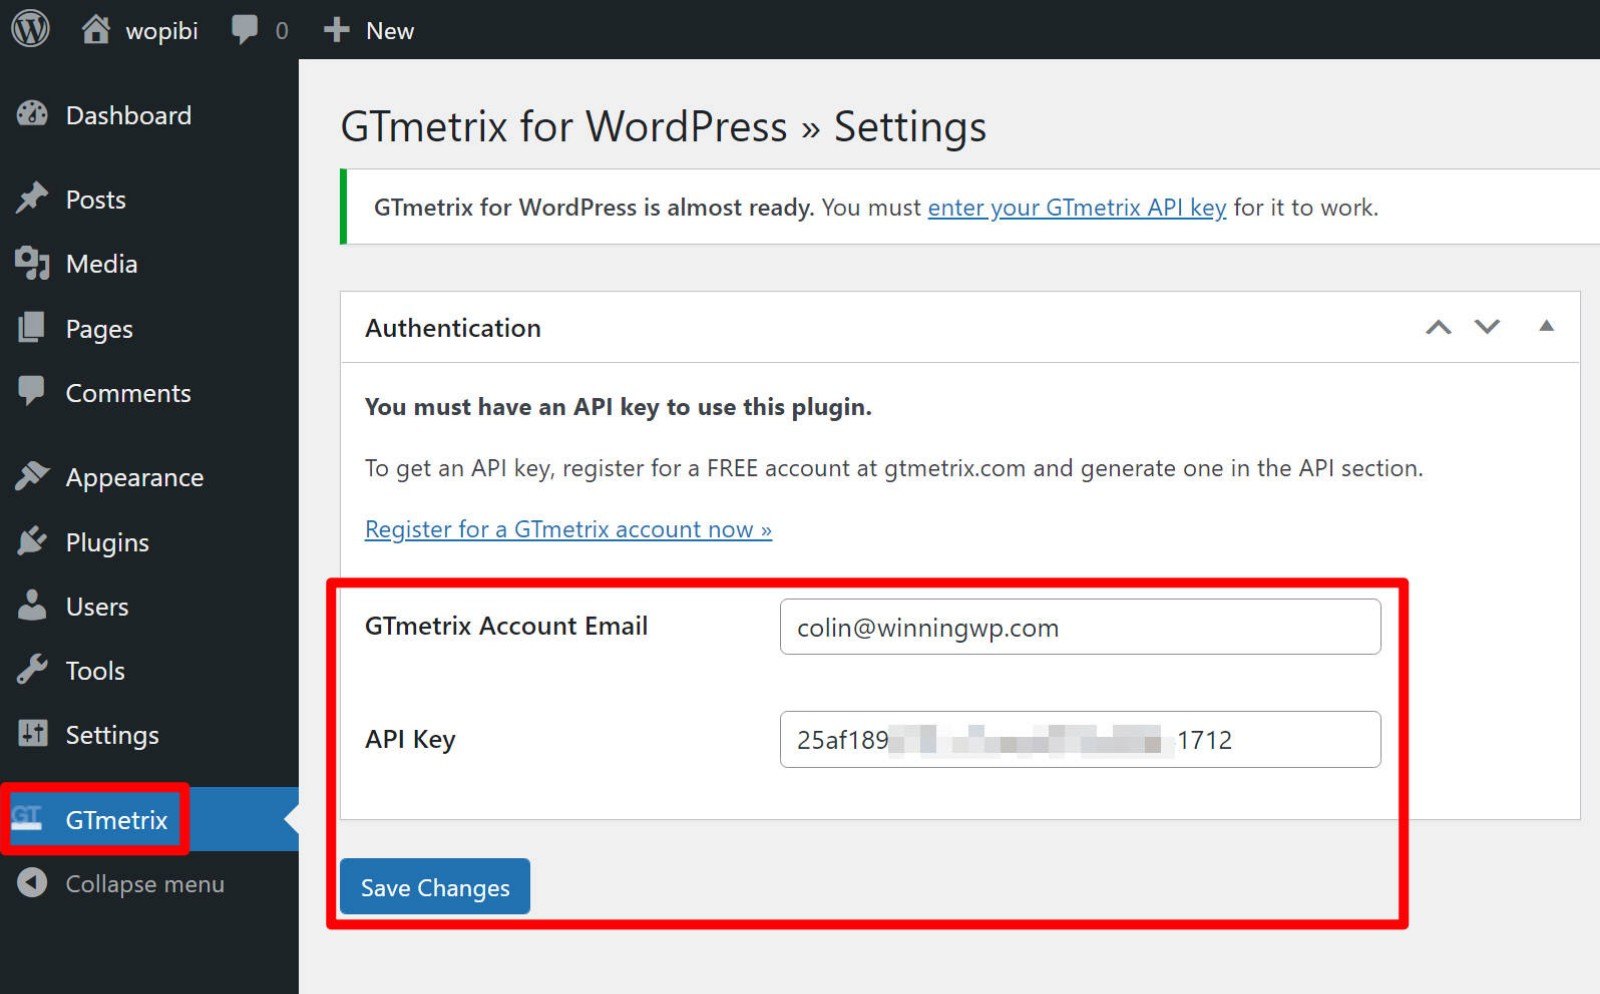
Once you activate the plugin, go to the new GTmetrix tab in your WordPress dashboard and enter the following information:
- GTmetrix account email
- GTmetrix API key — you can find this by going to your GTmetrix account page and clicking the Generate API Key button. You can get a GTmetrix API key even with a free account.
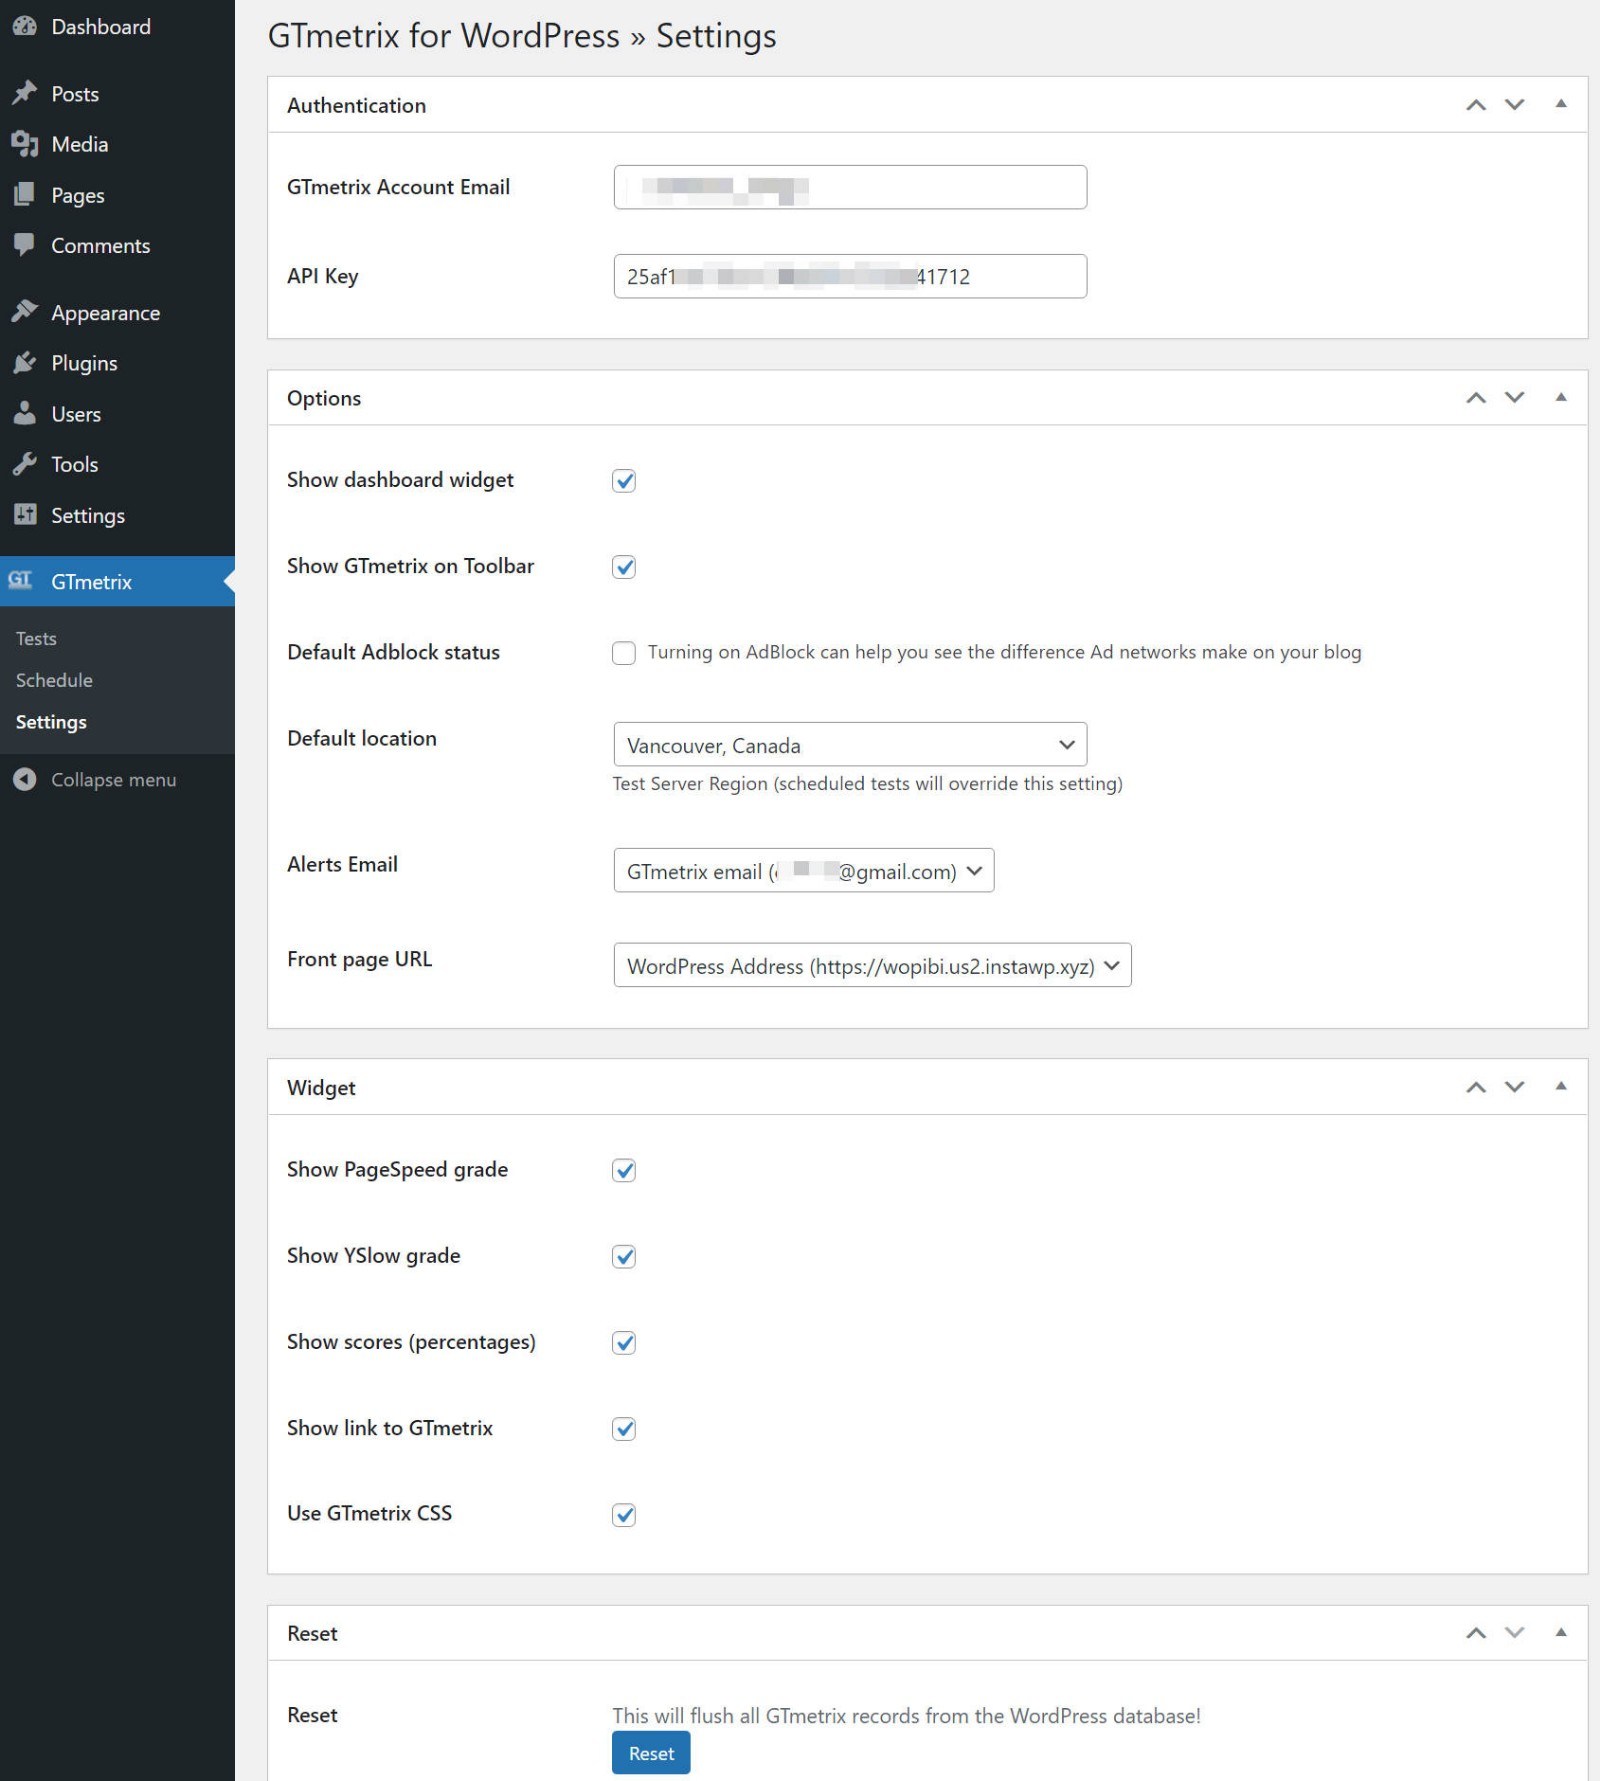
Once you save the settings, you’ll see a bunch of new options to configure how you want it to work. For example, which location to test from and which URL to test.
2. Start Running Tests
The GTmetrix WordPress plugin lets you run one-off tests as well as set up automatic scheduled tests.
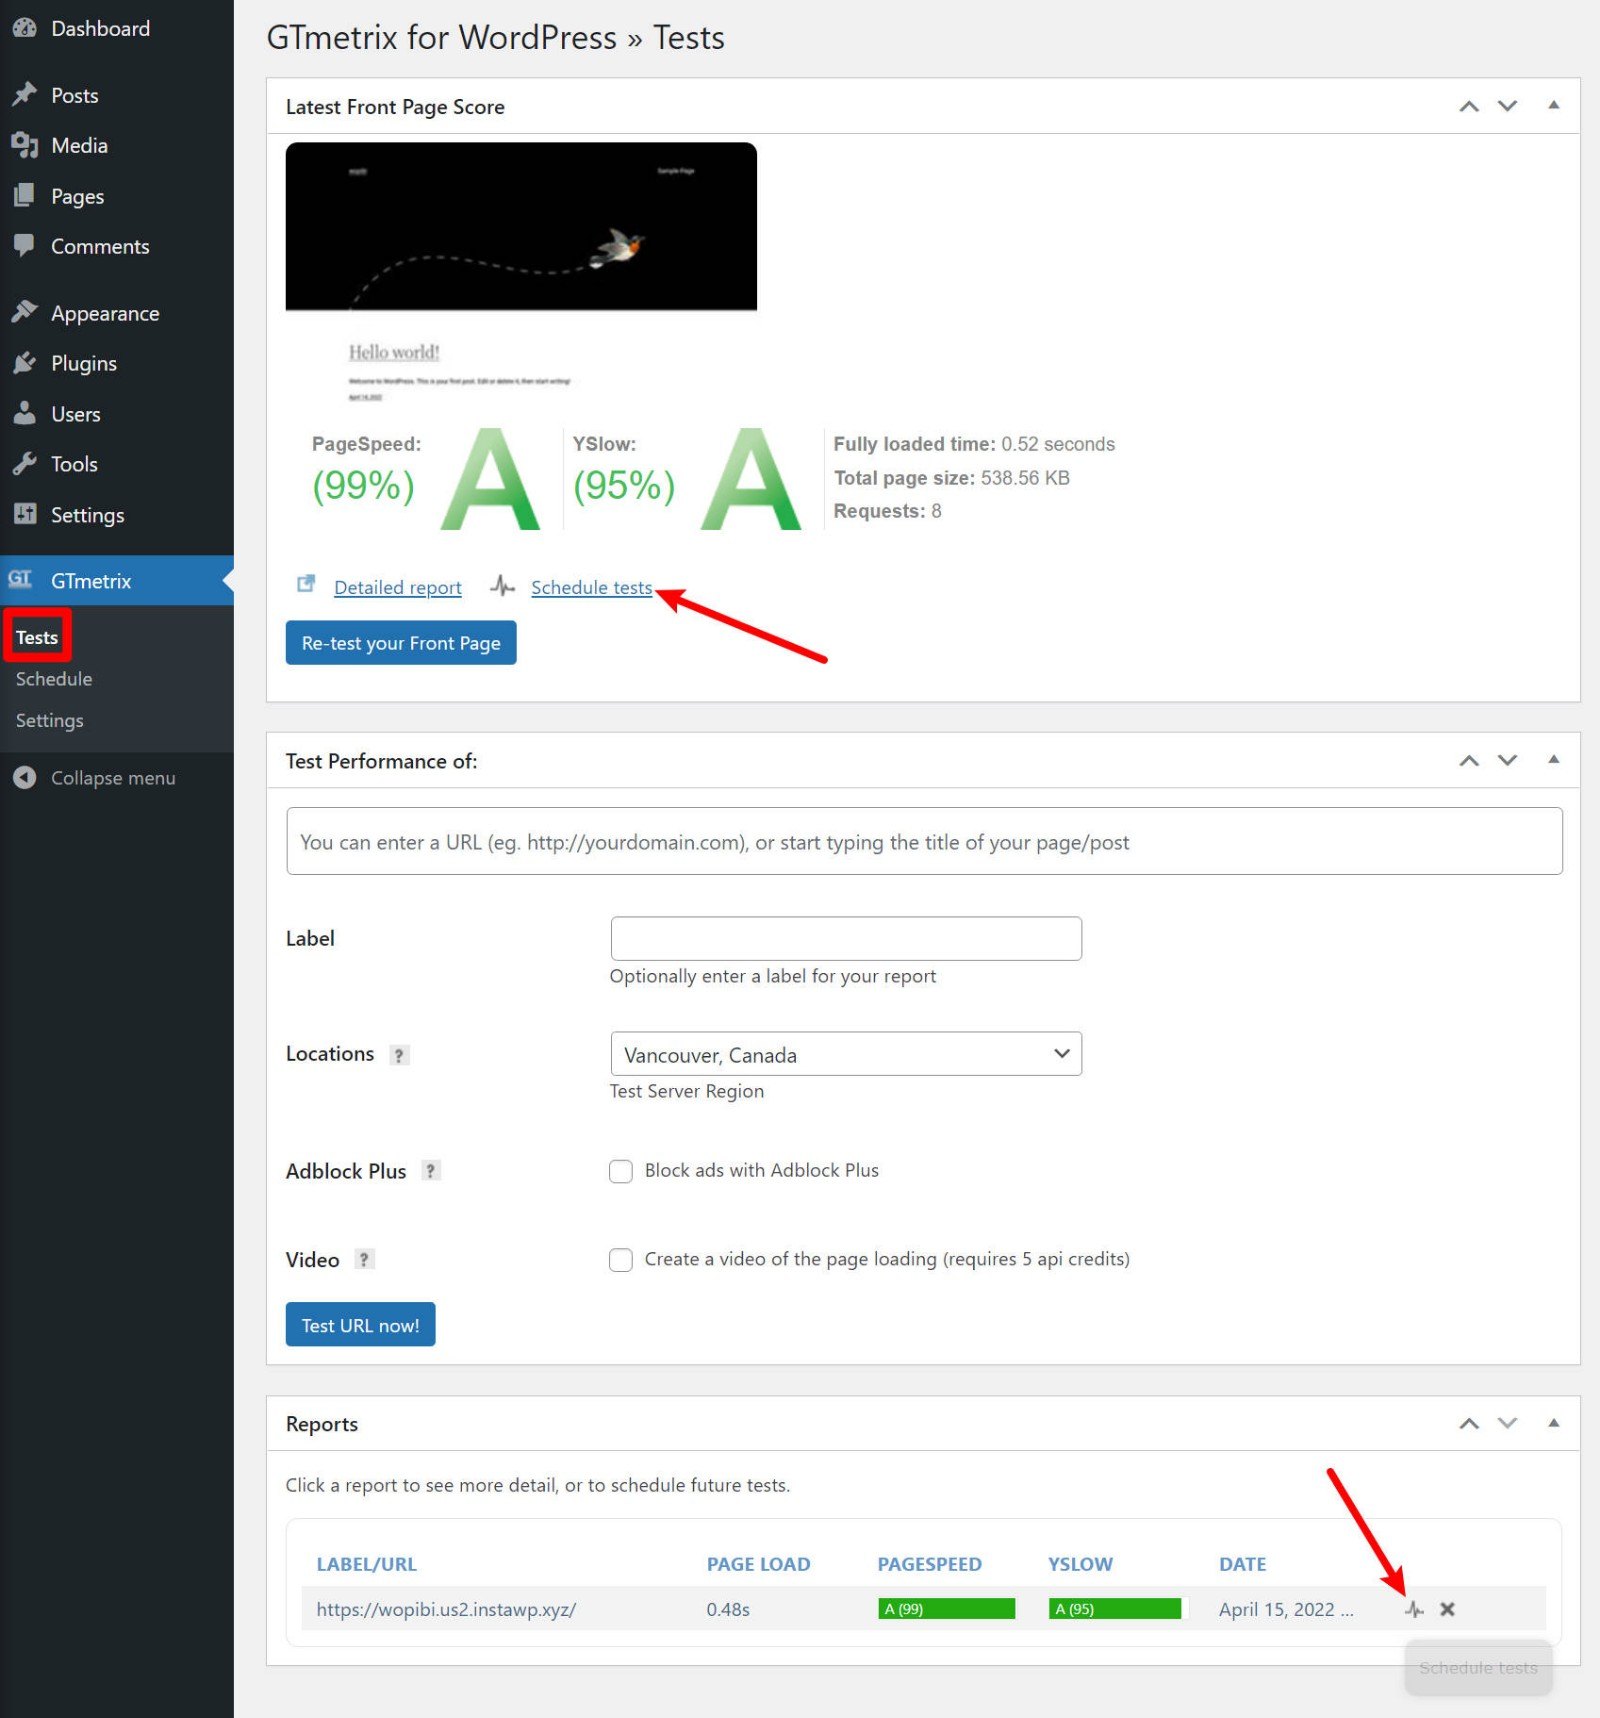
To run tests and view data, go to GTmetrix → Tests. Here, you’ll see the results of any previous tests as well as the option to test the performance of any page on your site.
If you want to schedule a test to run automatically, you can use one of the Schedule tests links:
This will open a new interface where you can configure the frequency of the test, as well as optional email alerts:
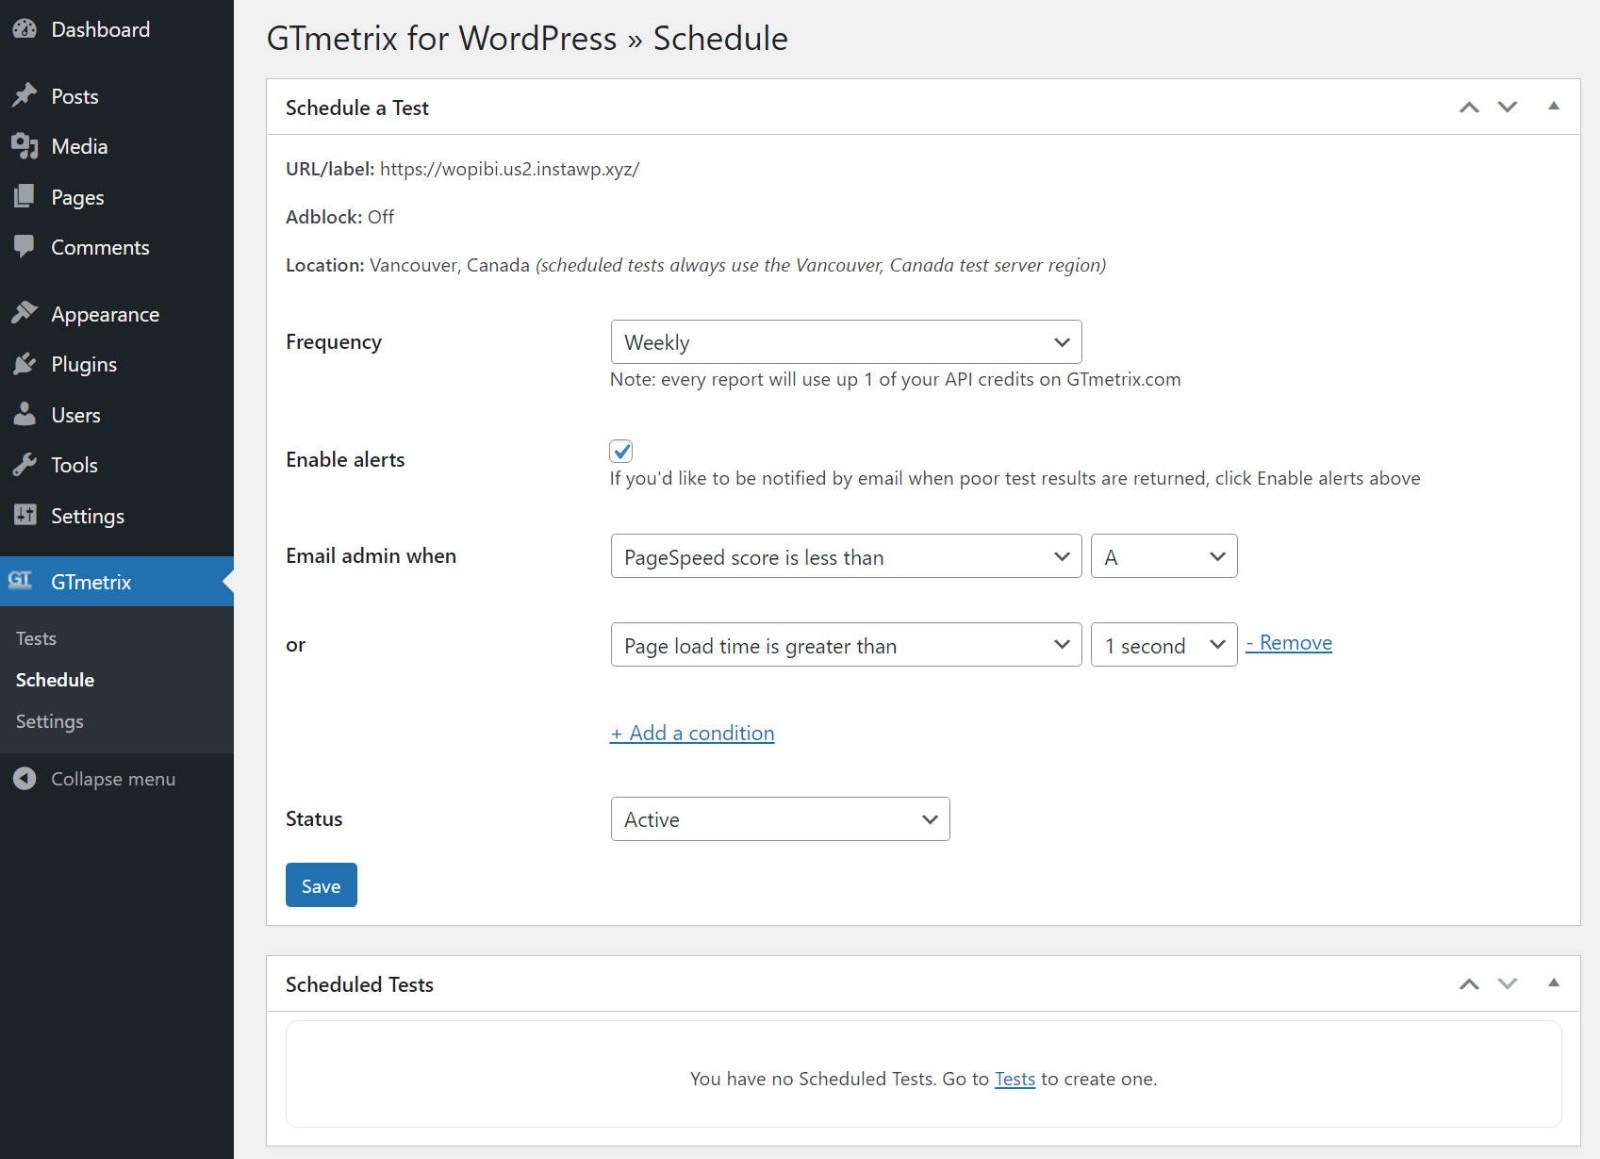
And that’s it for the GTmetrix WordPress plugin! I wish the plugin would be updated, so you could access the new Core Web Vitals reports. But, other than that, it’s a pretty handy option for WordPress performance monitoring.
Reasons to Consider GTmetrix’s Paid Plans
Up until now, everything you’ve seen is available with the free version of GTmetrix (although you’ll need to register for a free account).
GTmetrix also offers premium plans, though. So, what are some of the reasons to go Pro?
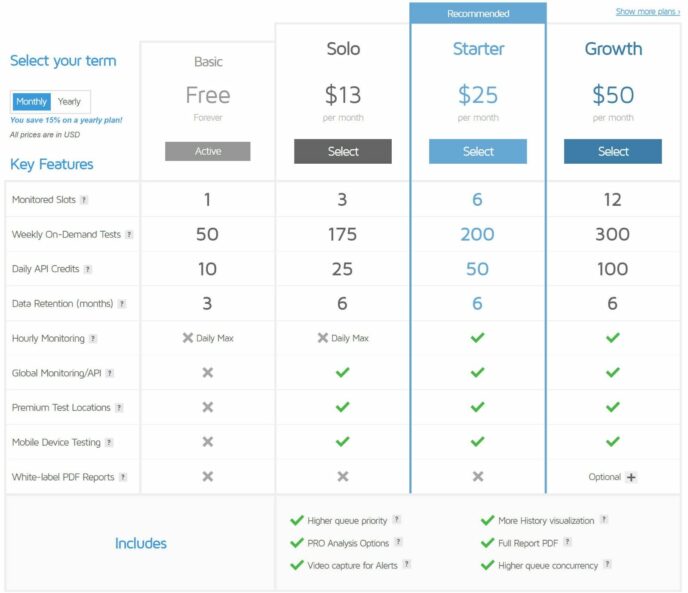
You already saw a few of the big ones:
- More options for automatic monitoring and alerts.
- Real mobile device testing to assess your site’s performance for different types of mobile visitors.
- More test locations — beyond the seven free ones, you’ll also get access to another 15 test locations around the world.
You’ll also get access to even more advanced test configuration options:
- Choose different screen resolutions or device pixel ratios.
- Set a user agent override.
- Add a DNS override.
- Create custom connection speeds, rather than just using the presets.
- Save test configurations as presets.
If you’re working with clients, you also get a feature that lets you white-label PDF reports, which gives you an easy way to provide a branded deliverable.
Finally, there are a few other perks:
- Longer data retention — six months vs the three months the free plan offers.
- Higher queue priority — you won’t ever need to wait to run tests.
- More advanced visualizations — for example, you get more options for viewing historical performance, and you can see video capture alerts.
GTmetrix Pro starts at $13 a month, with prices going up from there depending on your usage.
Speed Tips for WordPress Users
If you’re using WordPress, there are lots of strategies you can implement to increase your GTmetrix scores and, more importantly, reduce your page load times.
Here are some fixes you can implement:
- Ensure whatever web host you’re using uses servers that are optimized specifically for WordPress — and, if you’re still using generic, non-WordPress-optimized shared hosting, switch to something much, much faster, such as a web hosting plan from WP Engine, Flywheel or Kinsta.
- If you aren’t already, start using a page caching plugin, such as W3 Total Cache, WP Super Cache or WP Rocket. Read our comparison of these three plugins to pick the best option for your needs.
- Take some time to go through your site’s images and ensure they’re all as optimized as they can be (either re-optimize them in a program such as Photoshop or consider using a specialist service/plugin such as WP Smush, ShortPixel or Imagify).
- Make sure your site doesn’t have render-blocking JavaScript. Free plugins such as Async JavaScript and Autoptimize can help you to optimize your site’s JavaScript (they’re both from the same developer and pair well together). A newer tactic is also to delay loading JavaScript until a user interaction. You can set this up using WP Rocket, Perfmatters, FlyingPress or some other plugins.
- As painful as it may be, remove any unnecessary social media profiles from loading on your page (such as Facebook, Twitter and LinkedIn — all of which can quite literally add seconds to your page load times).
- Enable gzip compression, minify all scripts and leverage browser caching wherever possible.
- Perhaps most important of all, remove every unnecessary plugin that may be loading all manner of CSS and JavaScript files within your pages. Although there’s technically no limit to the number of plugins you can install on a WordPress-powered website, a very general rule of thumb is the more plugins, the slower the site! This isn’t totally true because the performance of each plugin matters more than the total number, but it’s still a good general rule of thumb for non-technical folks.
Any other super-effective quick fixes? Feel free to leave them in the comments below! ;)
For a more in-depth approach to WordPress speed optimization, check out these two detailed guides:
Four Best GTmetrix Alternatives
While GTmetrix is a really useful tool, it’s far from the only option for performance analysis.
Here are some of my other favorite performance analysis tools that you can use as true GTmetrix alternatives or in conjunction with GTmetrix.
1. WebPageTest
WebPageTest is my personal favorite GTmetrix alternative. It gives you even more flexibility for customizing your tests, but is still 100% free. The one downside is some parts of the interface aren’t as nice. For example, GTmetrix’s waterfall analysis interface is much more user-friendly.
2. PageSpeed Insights
PageSpeed Insights is the official performance testing tool from Google. It’s pretty similar to GTmetrix because both of them display many of the same metrics and rely on Lighthouse audits. One advantage, though, is you can see real field data from the Chrome User Experience report, which lets you see your site’s First Input Delay and other Core Web Vitals metrics for real users.
One big downside is it isn’t very configurable — e.g. you can’t change the test location or connection speeds.
3. Pingdom
Pingdom is a great GTmetrix alternative if you’re willing to pay for the premium plans. However, when comparing GTmetrix vs Pingdom in terms of free plans, Pingdom’s free speed testing tool is inferior.
With the paid plans, you get automatic performance monitoring, plus real-user performance monitoring (which lets you track your site’s performance for actual human visitors).
To learn more, check out our guide on how to use Pingdom.
4. SpeedCurve
SpeedCurve is an automatic performance monitoring tool for heavy-duty performance nerds. It’s more complicated than GTmetrix, but it also gives you a lot more data, plus the ability to set up your own custom performance monitoring dashboards.
The downside is the cheapest plan already costs $115 a month, which is why this is only a good option for heavy-duty use (such as enterprise performance monitoring).
Start Using GTmetrix More Effectively
If you want a fast website, you’ll need a comprehensive tool to test it under a number of circumstances. GTmetrix lets you do exactly that. By setting up automatic monitoring and testing from different locations, it’ll give you a complete picture of how your website performs.
Used properly in the battle against slow site speeds, GTmetrix also equips you with more than enough information to fight back by analyzing your site’s performance and making improvements.
Just remember: Test more than only your homepage; test each page more than once and from multiple locations; and keep the focus on actually reducing those load times rather than on maximizing your scores! Your site’s visitors care about metrics such as Largest Contentful Paint — they don’t care about your GTmetrix Structure score.
Related Reading:
Know of any GTmetrix tips or tricks? Leave a comment!
By
TOP DEALS


Leave a Reply
All comments are held for moderation. We'll only publish comments that are on topic and adhere to our Commenting Policy.
I was searching for the website speed checker and i got this blog. After reading this whole blog, I checked my site in GTMetrix Tool. Using GTMetrix report, I solved my all technical changes. Really, this article is very helpful for me. Thanks for sharing!