
Bluehost vs WP Engine: A Hands-On WordPress Hosting Performance Comparison
- By
- Last updated:
- Leave your thoughts
Trying to choose between Bluehost and WP Engine? These two are fairly different hosts — especially when it comes to price.
Bluehost are an affordable shared WordPress host, while WP Engine are a premium managed WordPress host with all the bells and whistles — and a price tag to match! But, if you want to host a WordPress site, these are two of the biggest names you’ll come across.
In this post, I’m going to compare Bluehost and WP Engine to help you to decide which one’s right for you.
I’m not too concerned with their feature lists — that’s something you can find easily enough by reading each host’s website.
Instead, I’m going to take a deep look at how each host performs by setting up an identical test site on each. After running some tests, I’ll help you to analyze the data and choose the best host for your needs and budget.
Table of Contents
What We’re Comparing
In this post, I’ll be specifically comparing these two plans:
- Bluehost — the shared Plus plan, which starts at just $4.95 a month.
- WP Engine — the cheapest Startup plan, which starts at $35 a month.
So yes, we’re comparing a $4.95-a-month plan with a $35-a-month plan and — spoiler alert — the $35-a-month plan has better performance.
However, just because WP Engine load faster at seven times the price, that doesn’t automatically mean they’re the right host for you.
The way to frame this Bluehost vs WP Engine comparison is:
- How big of a difference does paying $35 a month make vs $4.95 a month? You know WP Engine will perform better, but is the performance difference big enough to justify the increase in price?
- Do you need that extra performance? For a low-traffic site, choosing WP Engine may be like buying a McLaren F1 when you just putt around the city. Sure, the extra power is nice, but it’s only helpful if you use it. I’ll try to answer this by bringing in some outside data.
The Performance Tests
Let’s start by comparing the performance of each host.
To measure each site’s performance, I set up a test site for each host using the popular Avada theme. From there, I imported a full Avada demo site and installed some other popular plugins, such as Yoast SEO.
The goal was to create a site that mimicked a WordPress site in the real world. You can see a full screenshot of the demo site here, so you know what’s going on.
I didn’t make any performance tweaks on the site beyond what the host had already implemented:
- Bluehost — Bluehost come with their own Endurance Cache solution. I left this enabled and set it at the Normal level. The data center for my Bluehost server was located in Utah.
- WP Engine — WP Engine come with object and page caching via their EverCache solution. The data center for my WP Engine server was located in South Carolina.
First, I ran those sites through WebPageTest with the following configuration:
- Run nine separate tests and take the median value (to eliminate single-test variability)
- Test Server — Chicago, IL (I tried to find somewhere roughly in the middle between the Bluehost data center and the WP Engine data center)
- Connection — FIOS (20 Mbps download)
Then, I also ran each host through Load Impact to see how they performed under scale:
- Visitors: 50
- Time Period: Five minutes
- Test Location: Columbus, OH
And I did both of those tests on four separate days to get some more data points. So, long story short, this data is based on 36 different speed tests and four different Load Impact tests for each host.
Here’s the raw data first, and then I’ll share some analysis right after.
Day 1:
Again, this test data is the median value from nine separate tests. If you click on the links in the tables below, you can see all of the separate tests, and I’ve also calculated the mean average below the table if you’d rather see that number.
| Host | Load Time | First Byte | Speed Index | Fully Loaded |
| Bluehost | 2.859 s | 1.112 s | 3.225 s | 3.389 s |
| WP Engine | 1.765 s | 0.136 s | 2.052 s | 2.175 s |
The numbers above are for the median run. Here’s the mean average of all nine tests for the load time:
- Bluehost: 2.93 seconds
- WP Engine: 1.80 seconds
Bluehost Load Impact:
WP Engine Load Impact:
Day 2:
| Host | Load Time | First Byte | Speed Index | Fully Loaded |
| Bluehost | 3.601 s | 1.633 s | 4.021 s | 4.355 s |
| WP Engine | 1.642 s | 0.132 s | 2.046 s | 2.302 s |
The numbers above are for the median run. Here’s the mean average of all nine tests for the load time:
- Bluehost: 3.78 seconds
- WP Engine: 1.65 seconds
Bluehost Load Impact:
WP Engine Load Impact:
Day 3:
| Host | Load Time | First Byte | Speed Index | Fully Loaded |
| Bluehost | 3.753 s | 1.658 s | 4.196 s | 4.437 s |
| WP Engine | 2.477 s | 0.135 s | 2.901 s | 3.250 s |
The numbers above are for the median run. Here’s the mean average of all nine tests for the load time:
- Bluehost: 3.64 seconds
- WP Engine: 2.40 seconds
Bluehost Load Impact:
WP Engine Load Impact:
Day 4:
| Host | Load Time | First Byte | Speed Index | Fully Loaded |
| Bluehost | 3.519 s | 1.630 s | 3.893 s | 4.256 s |
| WP Engine | 1.835 s | 0.133 s | 2.202 s | 2.481 s |
The numbers above are for the median run. Here’s the mean average of all nine tests for the load time:
- Bluehost: 3.64 seconds
- WP Engine: 1.83 seconds
Bluehost Load Impact:
WP Engine Load Impact:
Analyzing the WebPageTest Data for Bluehost and WP Engine
Let’s start with the obvious conclusion: WP Engine are just plain faster than Bluehost — which you’d expect given the price differences between the two plans.
On every single day, WP Engine loaded the same site in ~half the time it took Bluehost.
The difference is even bigger when you look at the first byte data. Time to first byte measures how long it takes for just the first byte to be delivered from the server. Basically, it shows you how responsive the server is.
In all of the tests, it took WP Engine ~10% of the time it took Bluehost to respond, which is a pretty big difference. Basically, it takes Bluehost ~1.4 seconds just to start delivering your site, whereas WP Engine start pretty much right away.
To verify these results, and make sure they weren’t just down to a difference in location, I ran a few tests with Byte Check as well (a dedicated tool for measuring time to first byte). My WebPageTest test location was roughly equidistant between Bluehost and WP Engine, but I wanted to make sure I wasn’t being unfair.
You can see the same difference in Byte Check, though:
| Byte Check tests | Test 1 | Test 2 | Test 3 |
| Bluehost | 1472 ms | 2188 ms | 1366 ms |
| WP Engine | 92 ms | 78 ms | 77 ms |
Because it takes Bluehost well over a second to deliver even just the first byte, you’re never going to make your site load as fast as with WP Engine.
Analyzing Load Impact Data for Bluehost and WP Engine
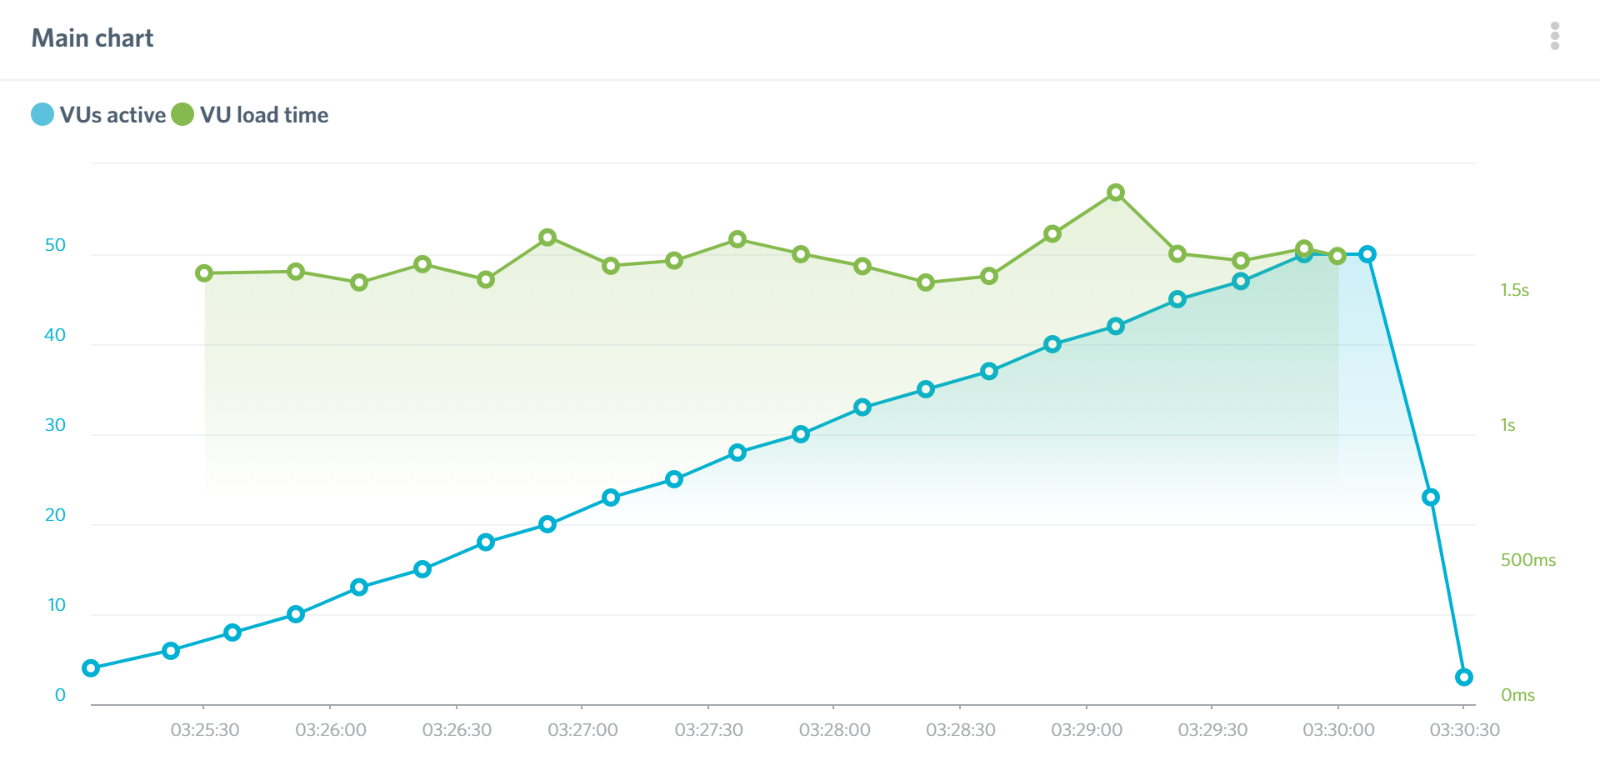
One thing that did surprise me, though, was the load impact data. If you’re not familiar with this test, it analyzes how a host can perform under scale by simulating 50 visitors browsing your site in the same five-minute span. It starts with a single visitor and then gradually ramps up the number of visitors over five minutes. At the end, there are 50 visitors all browsing at the same time.
Essentially, it’s answering the question: Will this host load a site just as quickly for the 50th active visitor as it does for the first visitor?
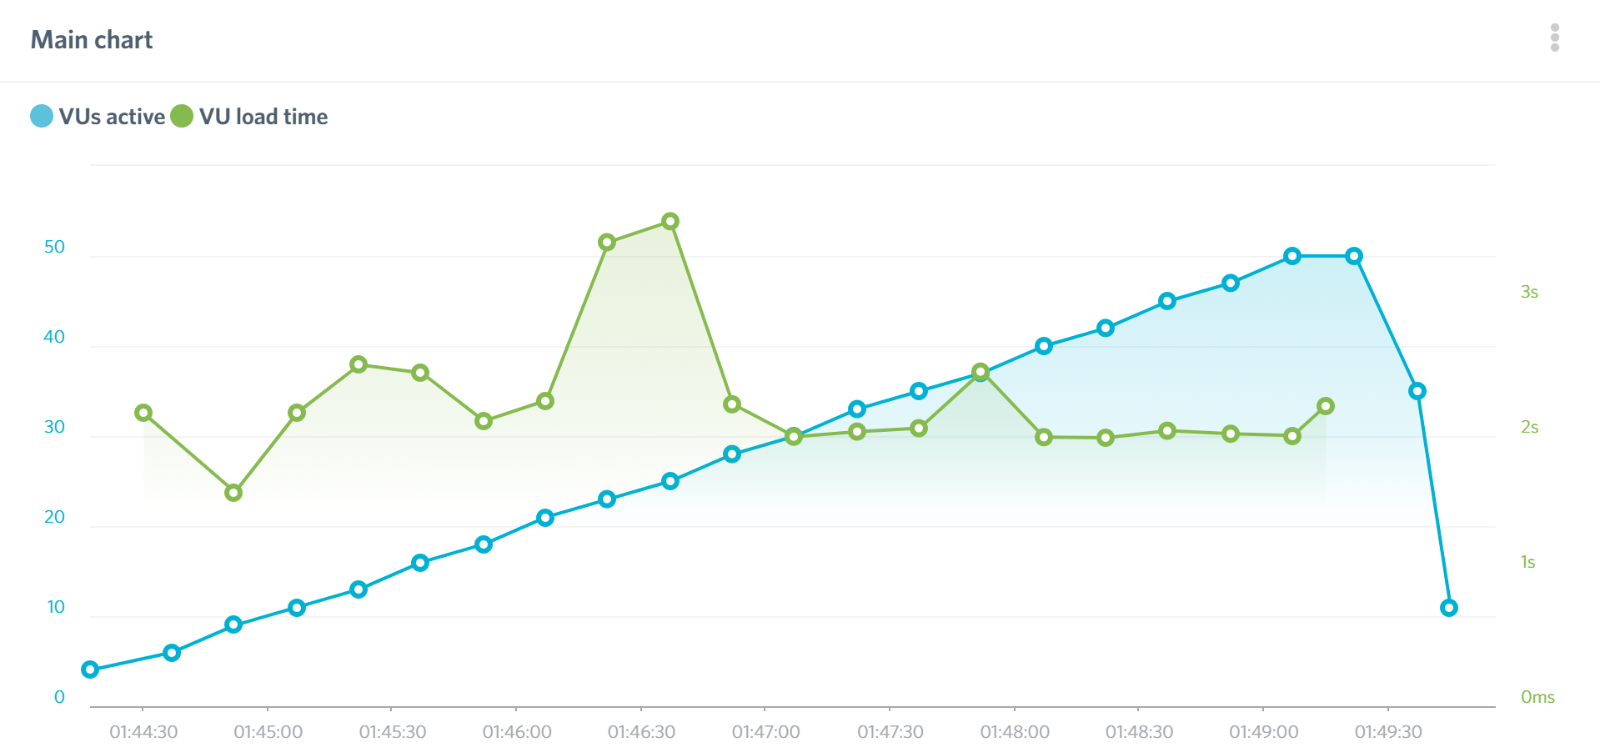
When I tested Bluehost with their own caching system turned off for our caching plugin comparison post, there was a noticeable spike in page load times around the 40-visitor mark. Here’s an example:
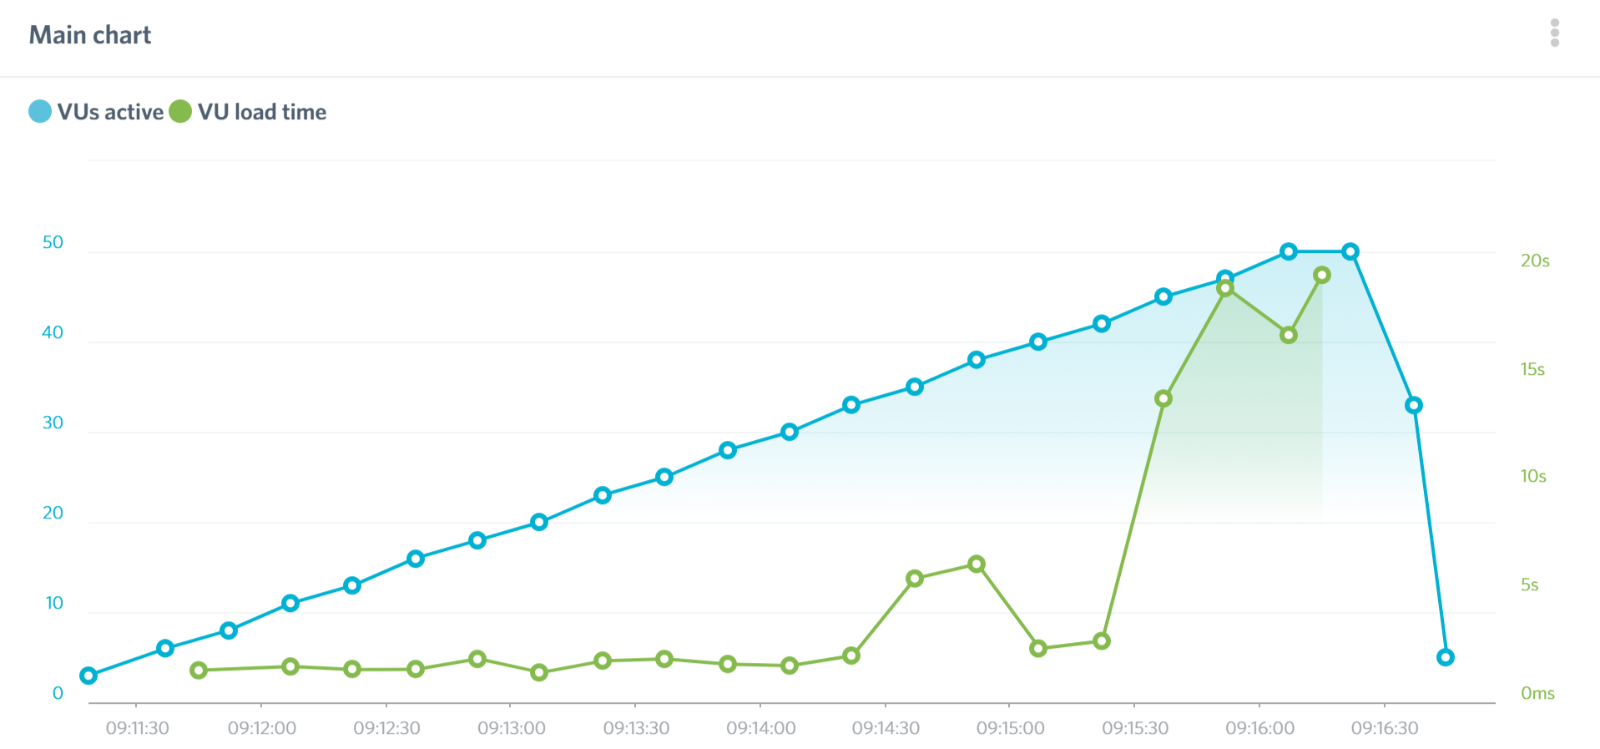
Essentially, this example is saying Bluehost were able to load the site quickly for the first 40 visitors, but once it got past 40 active users the page load times became erratic.
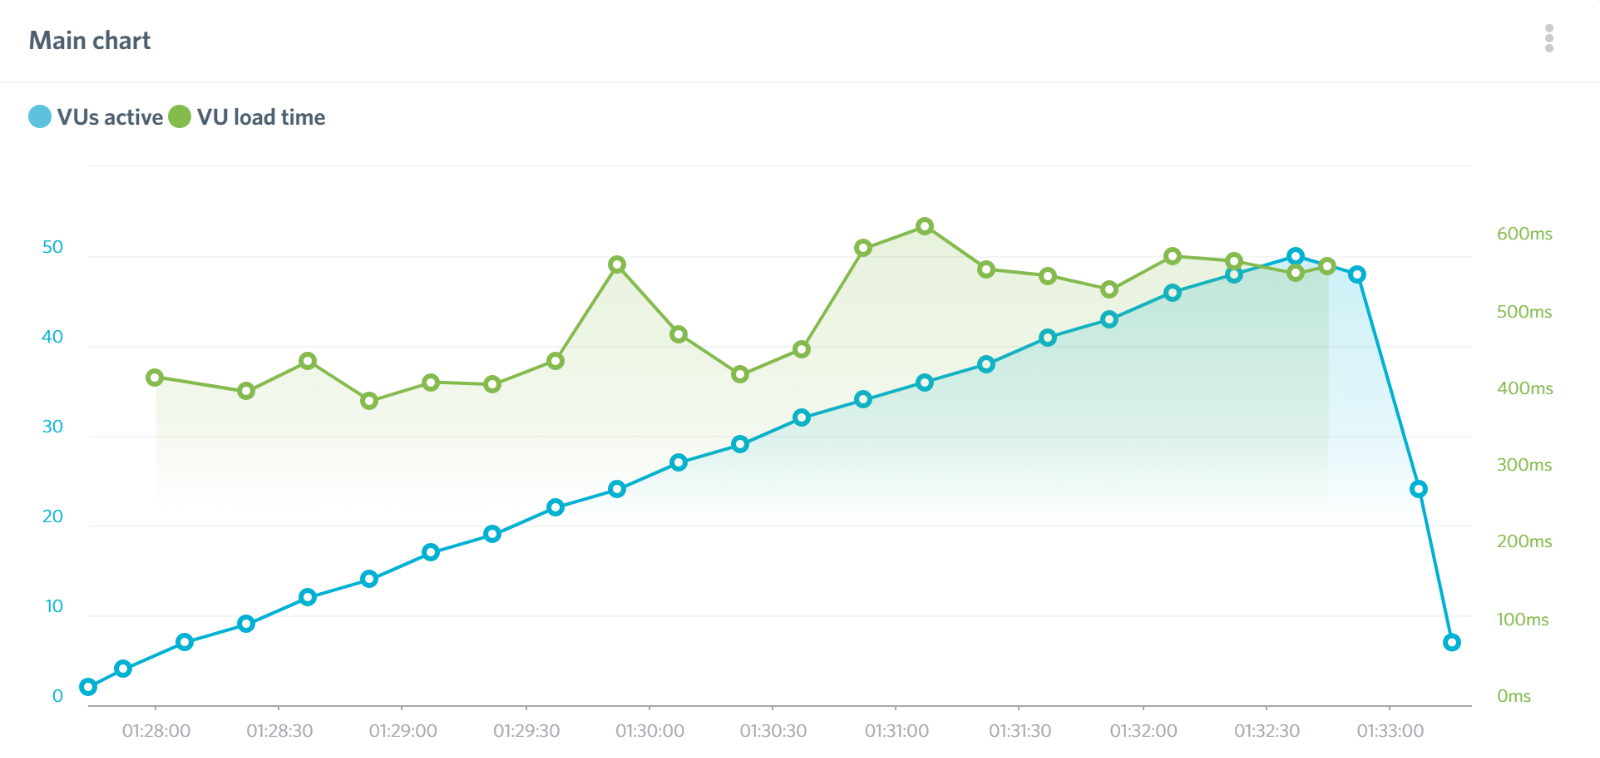
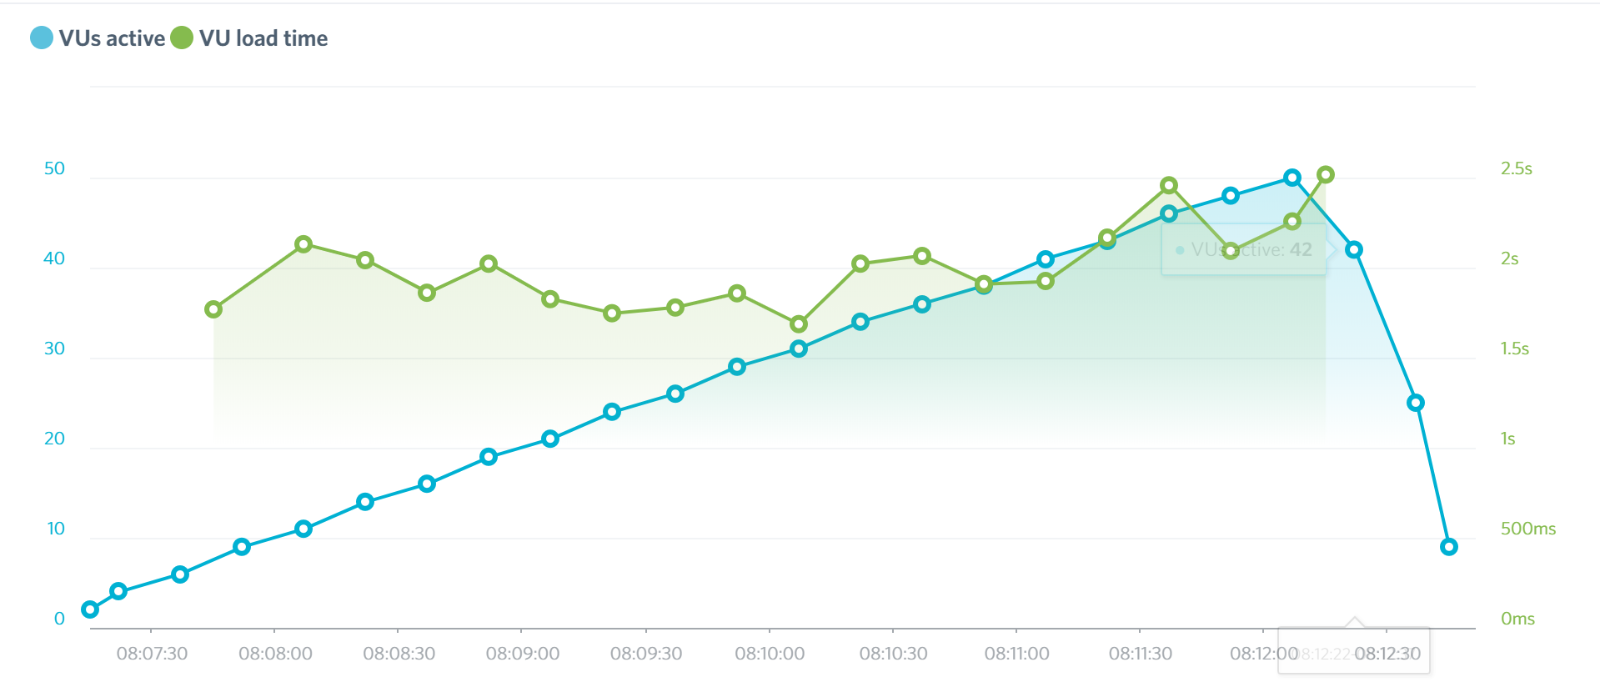
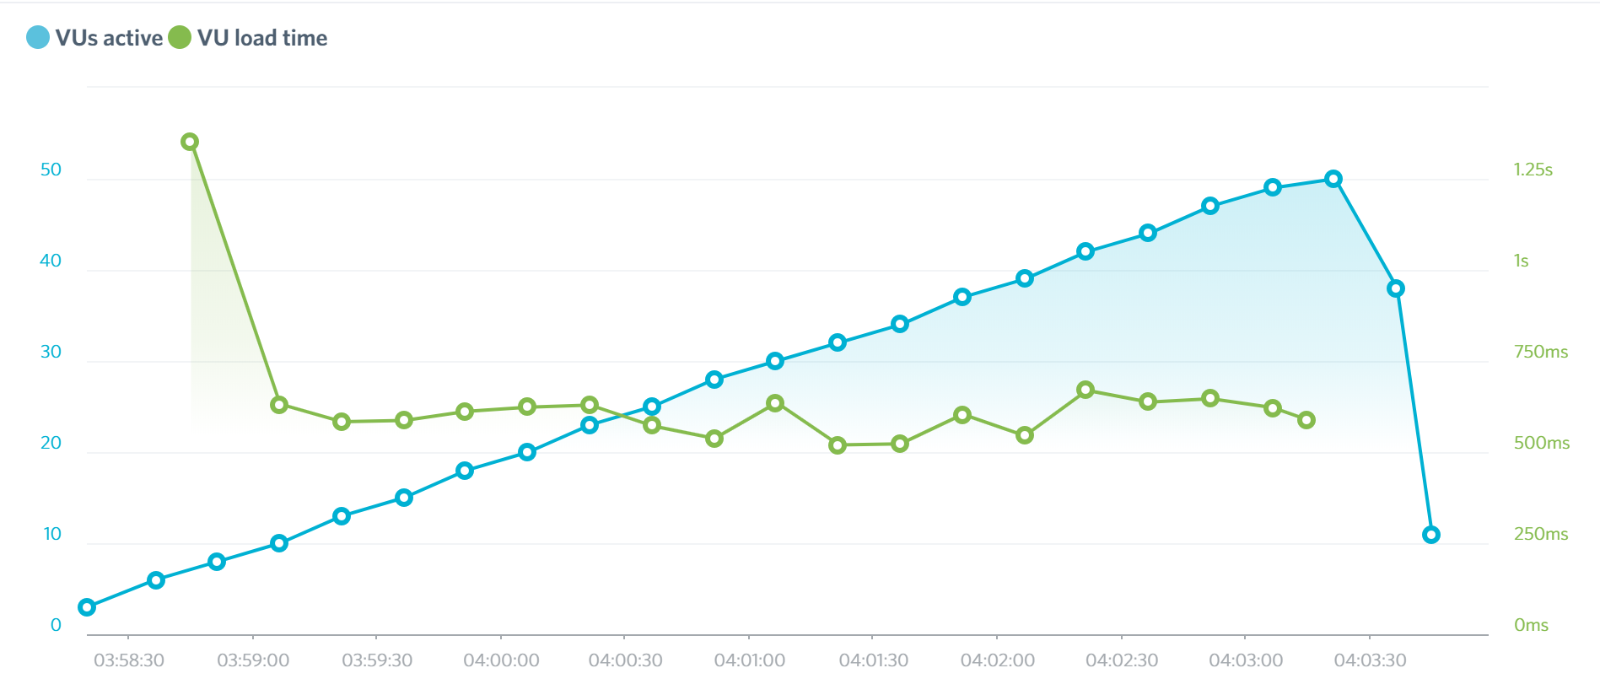
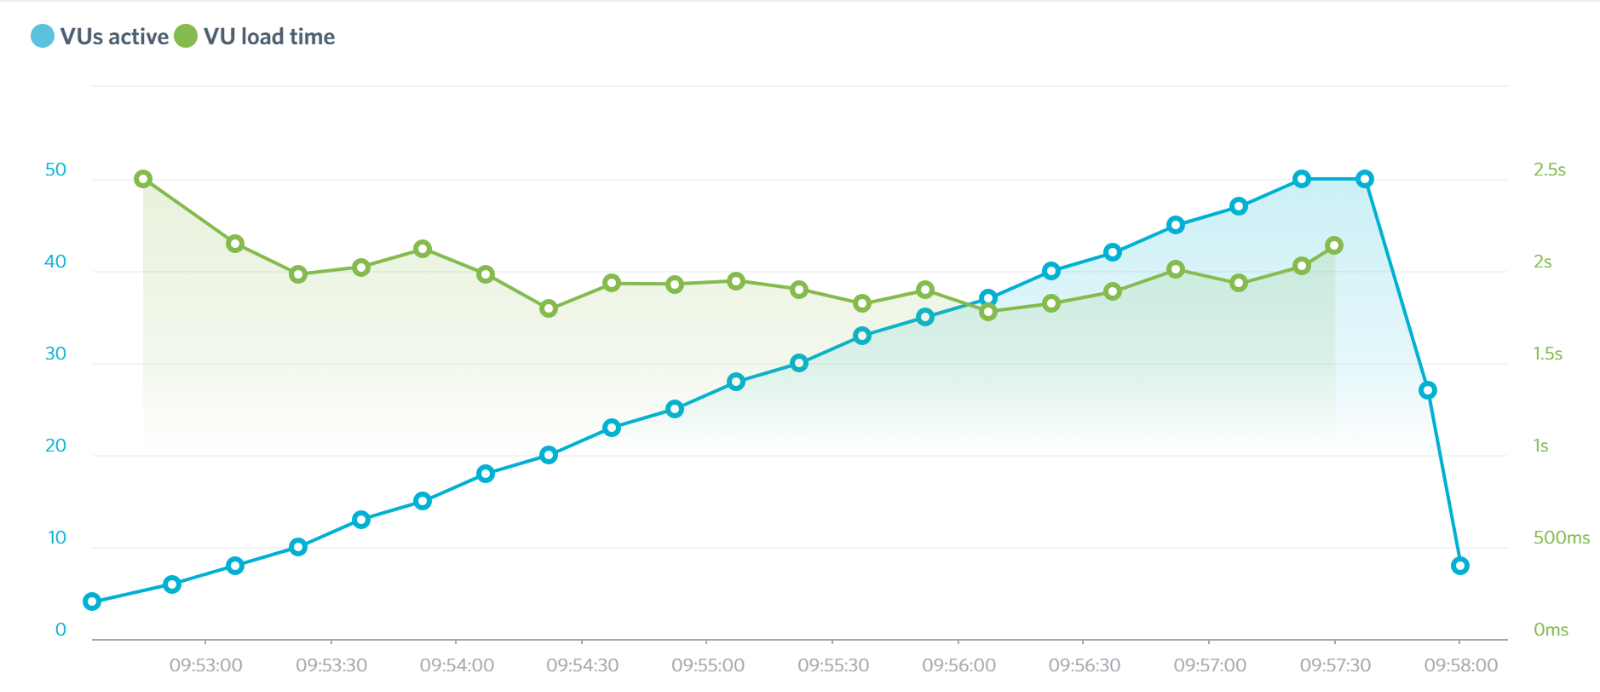
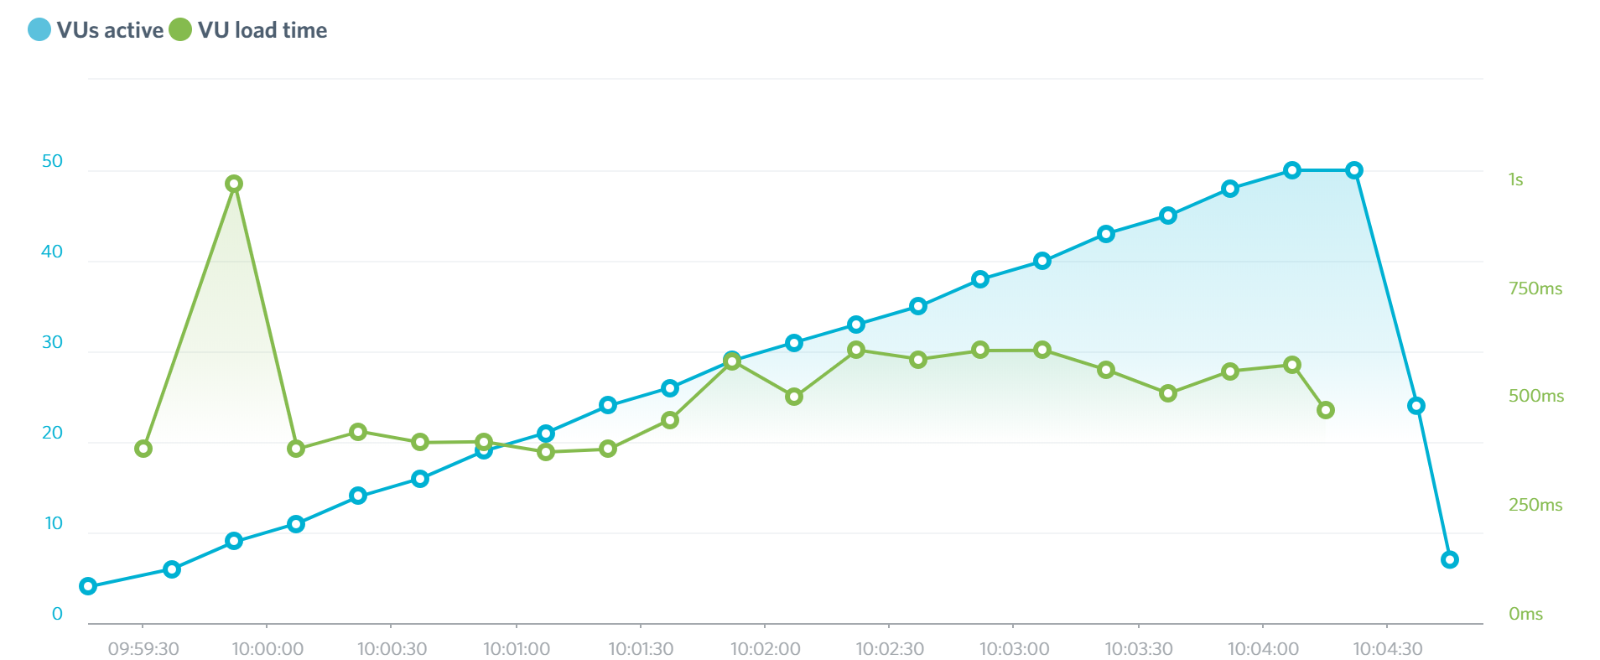
However, with Bluehost’s built-in caching enabled, this spike was absent and Bluehost managed to keep steady page load times for all 50 visitors.
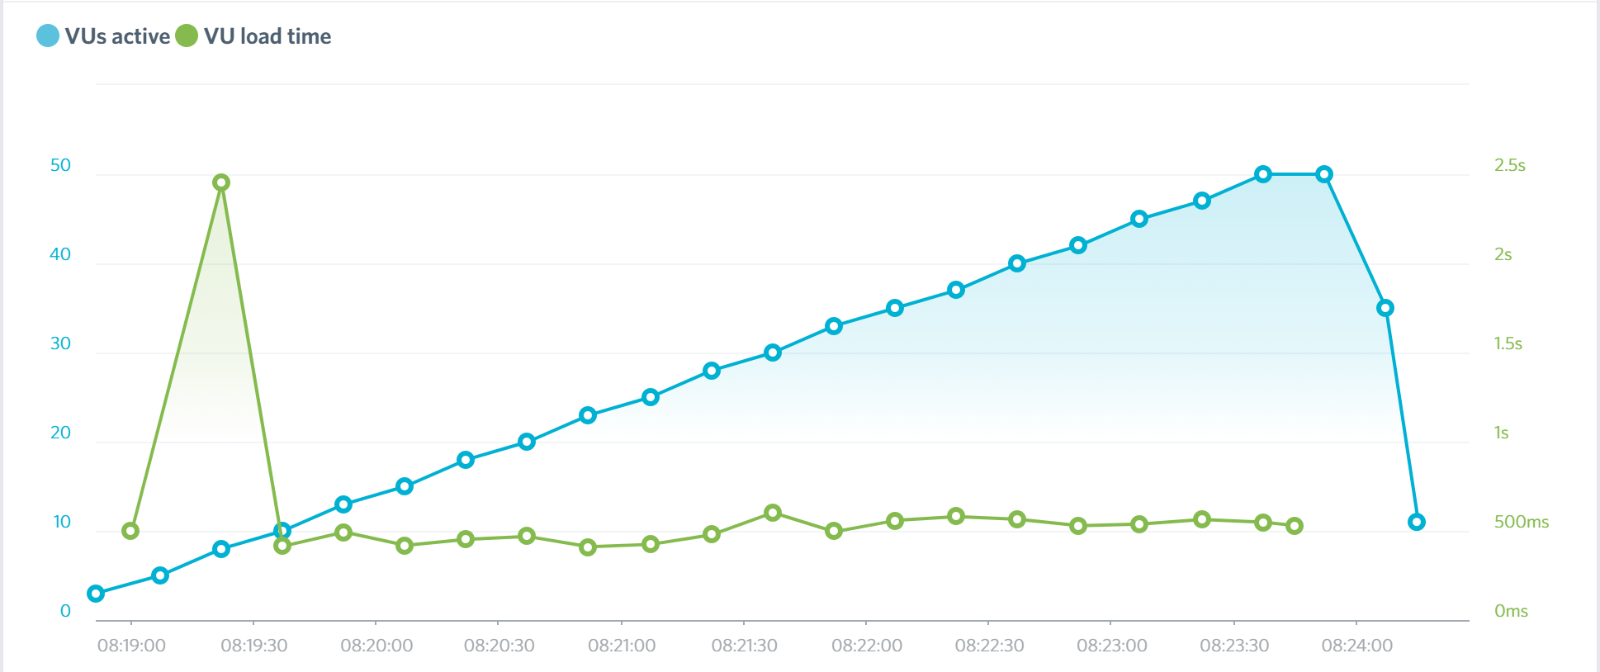
Now, WP Engine are still definitely faster — in all three tests, they hovered around 500 ms load times for all 50 visitors, while Bluehost were up in the 1.5-2 s range.
However, this does show that with Bluehost’s caching enabled you can handle up to 50 concurrent visitors, even on a cheap Bluehost shared plan… It just won’t be as fast as WP Engine.
Are Bluehost Fast Enough? Let’s Look at the Data
Okay, so WP Engine are faster than Bluehost — that’s pretty clear from all of the test data. But that brings up yet another interesting question: Are Bluehost fast enough?
That is, for the average site, does the difference between Bluehost’s ~3 second load times and WP Engine’s ~1.5 seconds really matter?
Well, first off, let’s look at what the big names say. John Mueller, the Webmaster Trends Analyst at Google, says: ‘I often check http://webpagetest.org and aim for <2-3 secs.’
Given John’s position at Google, that’s definitely something to pay attention to.
However, according to Pingdom’s data (which it definitely has plenty of!), the average website loads in 3.21 seconds, which is pretty much smack dab around where our Bluehost test site landed.
But here’s the thing:
Pingdom’s data also shows that average isn’t quite good enough. It plotted bounce rate versus page load times and found:
- the average bounce rate for pages loading in under two seconds is 9%
- as soon as the page load time gets above three seconds, the bounce rate starts shooting up.
You can see the connection in the table below:
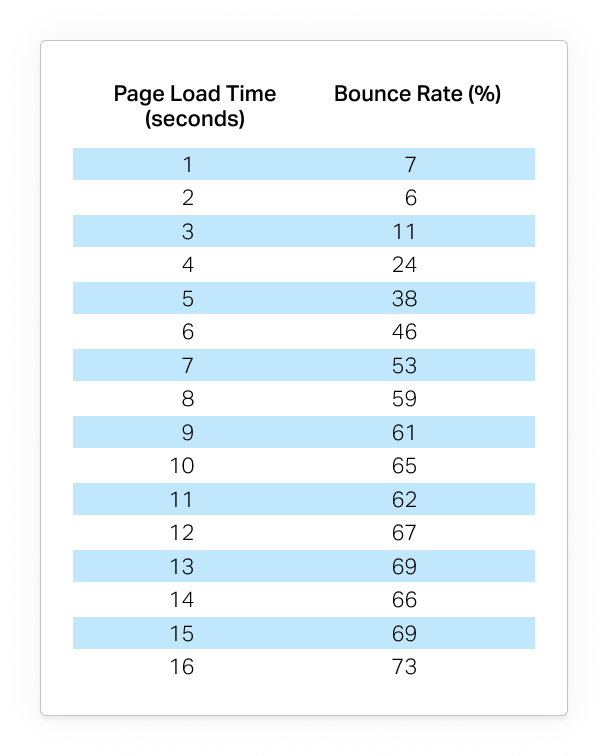
This jives with other page load time statistics:
- Google found that bounce rate increased by 32% when going from one-second load times to three-second load times (on mobile)
- Akamai analyzed eCommerce stores and found that ‘a hundred-millisecond delay in website load time can hurt conversion rates by 7%’ and ‘a two-second delay in web page load time can increase bounce rates by 103 percent’.
Basically, the data seems to show that getting under that two-second mark can make a noticeable impact on your site when it comes to bounce rates and engagement. And, based on our test data, WP Engine get you there, while Bluehost don’t.
So, for that reason, investing in better-quality hosting such as WP Engine can have a positive impact on your site… If it’s within your budget.
Final Thoughts and Considerations
At this point, I’ve pretty much summed up the key performance differences between WP Engine and Bluehost. So, let’s finish this post with a brief summary of some of the other things you may want to consider.
First off, WP Engine are a managed WordPress host, which means you also get other helpful features such as automatic backups, easy staging sites and more. So, you’re not just getting better performance, you’re also getting some convenient features, too.
Second, they use different backend dashboards. WP Engine use an entirely custom dashboard, whereas Bluehost use a combination of their own custom dashboard and cPanel.
Finally, there’s the difference in payment plans — WP Engine let you pay month-to-month, while Bluehost make you pay for a year upfront.
All in all, there’s definitely a reason to consider using WP Engine over Bluehost if it fits your budget. Beyond loading your site more quickly — which has an effect on user experience and metrics such as bounce rate — you’ll also get all of those nice managed hosting features and the custom dashboard.
If you’d like a deeper look, check out our full WP Engine review.
Used/using either Bluehost or WP Engine? Thoughts?


All comments are held for moderation. We'll only publish comments that are on topic and adhere to our Commenting Policy.